By ATGL
Updated May 1, 2026
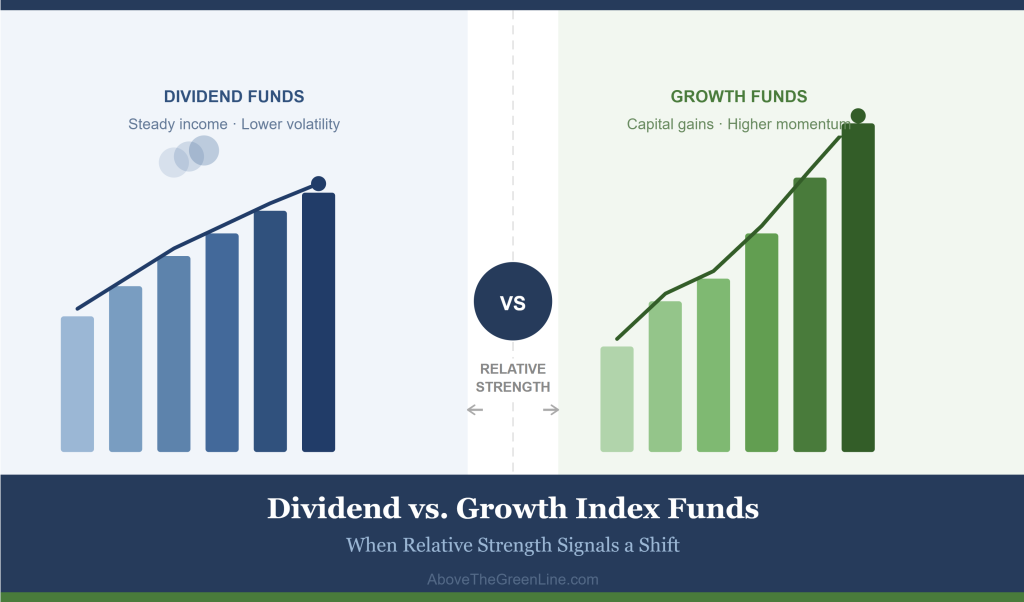
Investors managing long-term portfolios, the decision between index funds that pay dividends and growth-oriented index funds is rarely straightforward. Both categories carry distinct risk and return profiles, and performance leadership shifts depending on macroeconomic conditions. Rather than selecting one fund category and holding it indefinitely, a systematic, signal-driven approach to rotation — anchored in relative strength and technical indicators — can improve overall portfolio efficiency. Above the Green Line’s (ATGL) methodology provides a structured framework for identifying these transitions before they become apparent in price action.
For a broader foundation on how exchange-traded funds are structured and how different ETF types fit within a portfolio, refer to our comprehensive ETF Investing Guide.
Defining Dividend and Growth Index Funds
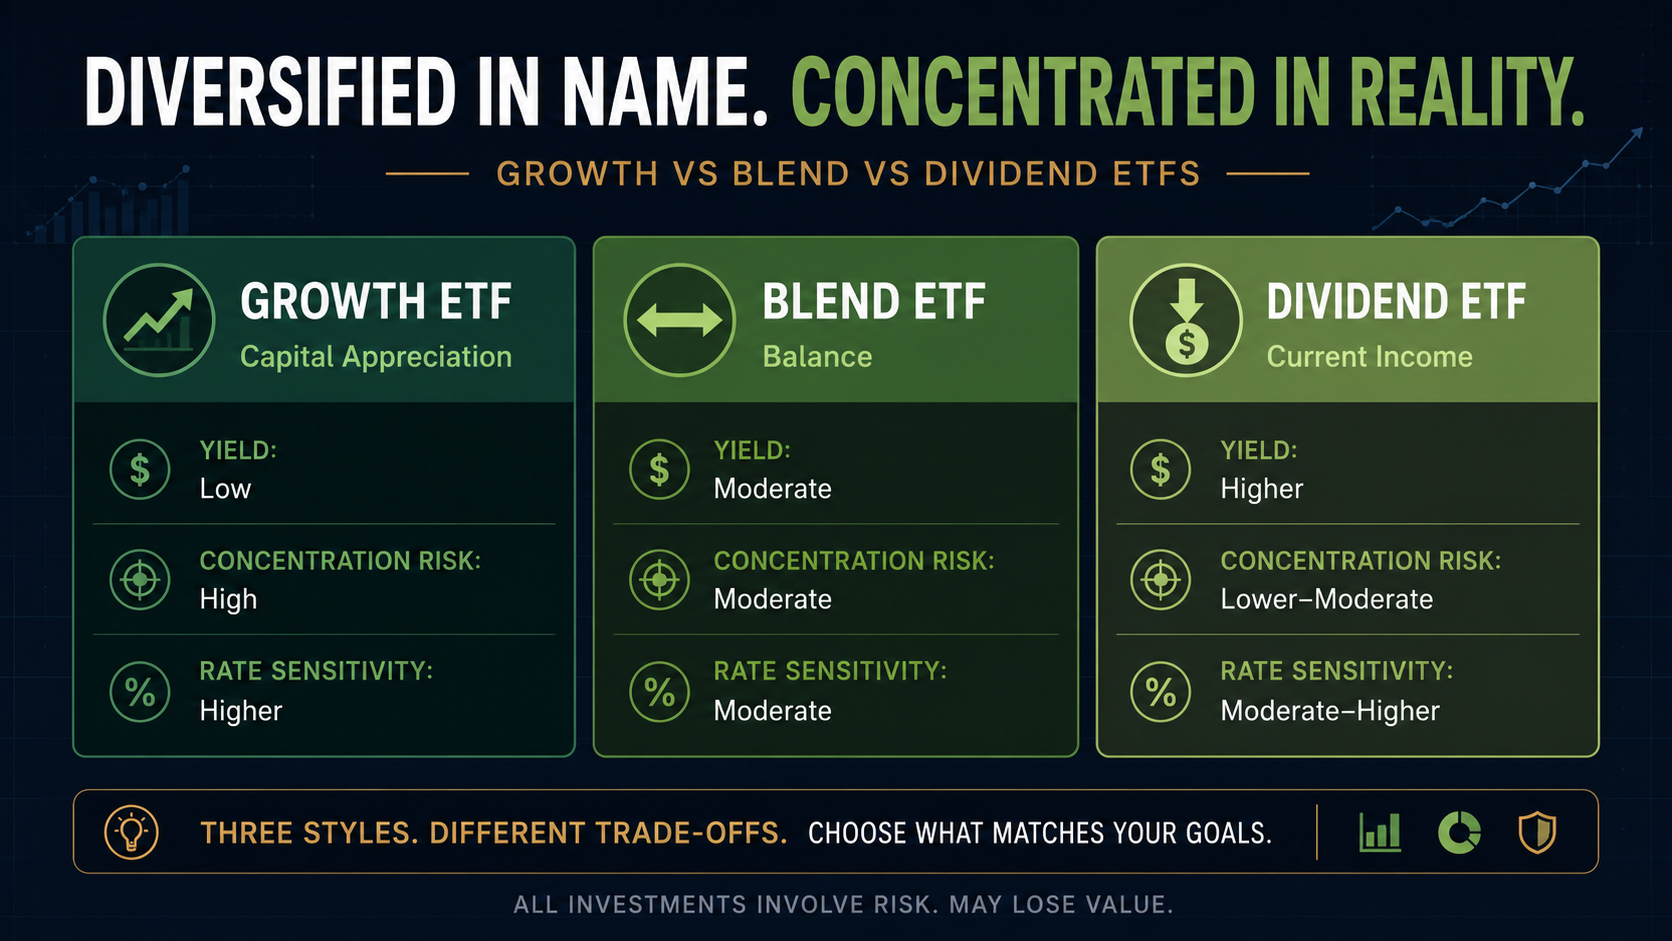
Dividend index funds track indexes composed of companies with consistent dividend payment histories. Funds such as the Vanguard High Dividend Yield Index Fund (VHYAX) and the Schwab U.S. Dividend Equity ETF (SCHD) are widely held U.S. market examples. These funds select constituents based on dividend yield, payout consistency, or dividend growth history. Investors can receive dividends from index funds — when the underlying holdings distribute dividends, the fund passes them through to shareholders, typically on a quarterly basis.
Growth index funds, by contrast, track indexes weighted toward companies with high earnings growth potential. The Nasdaq-100 is a primary benchmark, concentrating on large-cap technology and innovation-driven companies. These funds prioritize capital appreciation over income distribution, making them sensitive to interest rate movements and shifts in risk appetite. Understanding the structural ETF vs. index fund distinctions between vehicle types establishes the foundation for a sound rotation strategy.
Utilizing Relative Strength to Compare Dividend and Growth Performance
Relative strength is a momentum-based metric that measures the performance of one asset against another over a defined period. The formula is:
Relative Strength = Price of Asset A ÷ Price of Asset B
When comparing a dividend index fund against a growth benchmark like the Nasdaq-100, a rising ratio indicates the dividend fund is outperforming; a declining ratio indicates underperformance. Tracking this ratio over 12-week or 26-week periods helps identify durable trend shifts rather than short-term fluctuations. For example, if SCHD rises 8% over 13 weeks while QQQ gains 3%, the relative strength ratio trends upward, signaling a rotation into income-oriented assets.
For investors monitoring QQQ dividend holdings alongside growth allocations, relative strength charts provide an objective comparison against income-generating alternatives. When the ratio begins trending upward from a prior low, capital may be rotating from growth into dividend-paying index funds.
Market Conditions Favoring Dividend-Focused Index Strategies
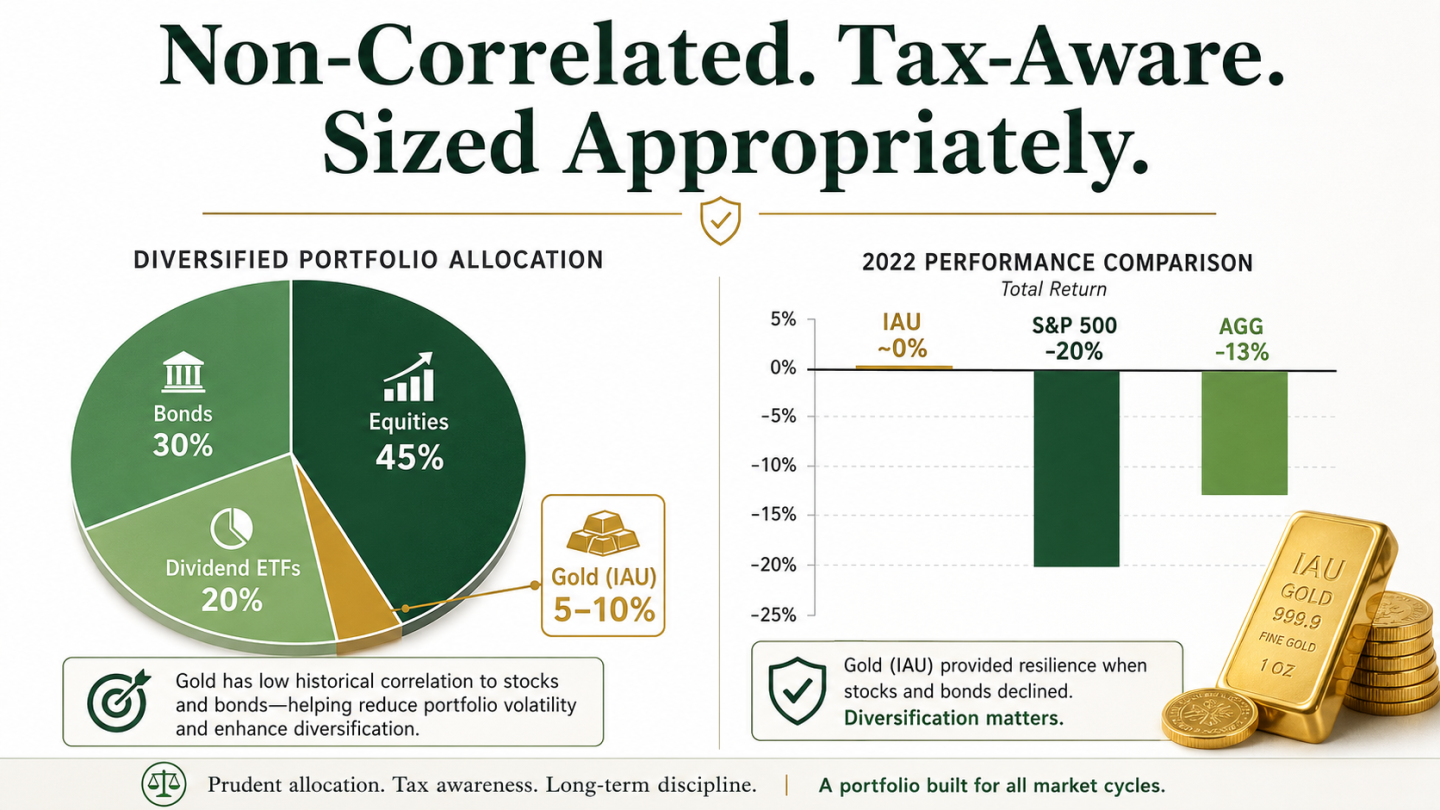
Dividend index funds tend to demonstrate higher relative strength during specific macroeconomic environments. Rising interest rate cycles, value-led market rotations, and elevated volatility historically shift investor preference toward income-producing assets. When growth stocks face multiple compression — where price-to-earnings ratios contract as discount rates rise — high dividend index funds often preserve value more effectively due to their cash flow characteristics.
Late-cycle and recessionary environments also tend to favor dividend strategies. Sectors such as utilities, consumer staples, and financials carry higher representation in dividend indexes, offering more defensive positioning than growth-concentrated alternatives.
Applying Moving Averages to Identify Optimal Entry Points
Moving averages function as dynamic support and resistance levels for index fund positions. The 200-day moving average — referenced as the “Green Line” in ATGL’s methodology — defines the long-term trend. When a dividend index fund trades above its 200-day moving average and that average slopes upward, the technical posture supports accumulation.
The 50-day moving average provides a shorter-term entry signal. A crossover of the 50-day above the 200-day confirms trend strength and marks a buy zone. The inverse crossover, where the 50-day falls below the 200-day, identifies a potential exit point. These signals remove subjective judgment from the rotation process and create a repeatable decision framework.
Systematic Rotation and Risk Management Protocols
Portfolio rotation based on technical crossovers — rather than yield-chasing — reduces exposure to value traps: dividend funds offering high yields due to declining prices rather than strong fundamentals. When relative strength for dividend index funds trends upward and moving average signals confirm the shift, reallocating from growth positions into index funds to invest in with technically sound setups follows directly from the data.
Risk management protocols should define position sizes and drawdown thresholds in advance. A dividend index fund that breaks below its 200-day moving average on elevated volume may signal deteriorating fundamentals, warranting a reduction in exposure regardless of current yield.
Analyzing Total Return: Capital Appreciation vs. Income Yield
Total return — the combined measure of capital appreciation and dividend income — offers a more complete performance benchmark than yield alone. High dividend index funds may produce steady income but lag in price appreciation during strong bull markets. Growth index funds may generate significant capital gains but offer minimal current income.
Dividend aristocrats — companies with 25 or more consecutive years of dividend increases — tend to exhibit lower volatility profiles than high-growth technology ETFs. This characteristic typically translates into more controlled drawdowns during market corrections. A dividend growth strategy that prioritizes rising payouts over maximum current yield often produces superior risk-adjusted returns across full market cycles.
Realistic Expectations for Dividend Income and Principal Requirements
Generating $1,000 per month in dividend income requires a clear-eyed assessment of fund yields and invested principal. At an average yield of 3%, an investor would need approximately $400,000 in dividend index funds to reach that monthly threshold. Generating $3,000 per month at the same yield requires roughly $1.2 million in capital, or a smaller principal allocated to high dividend index funds yielding 4–5%.
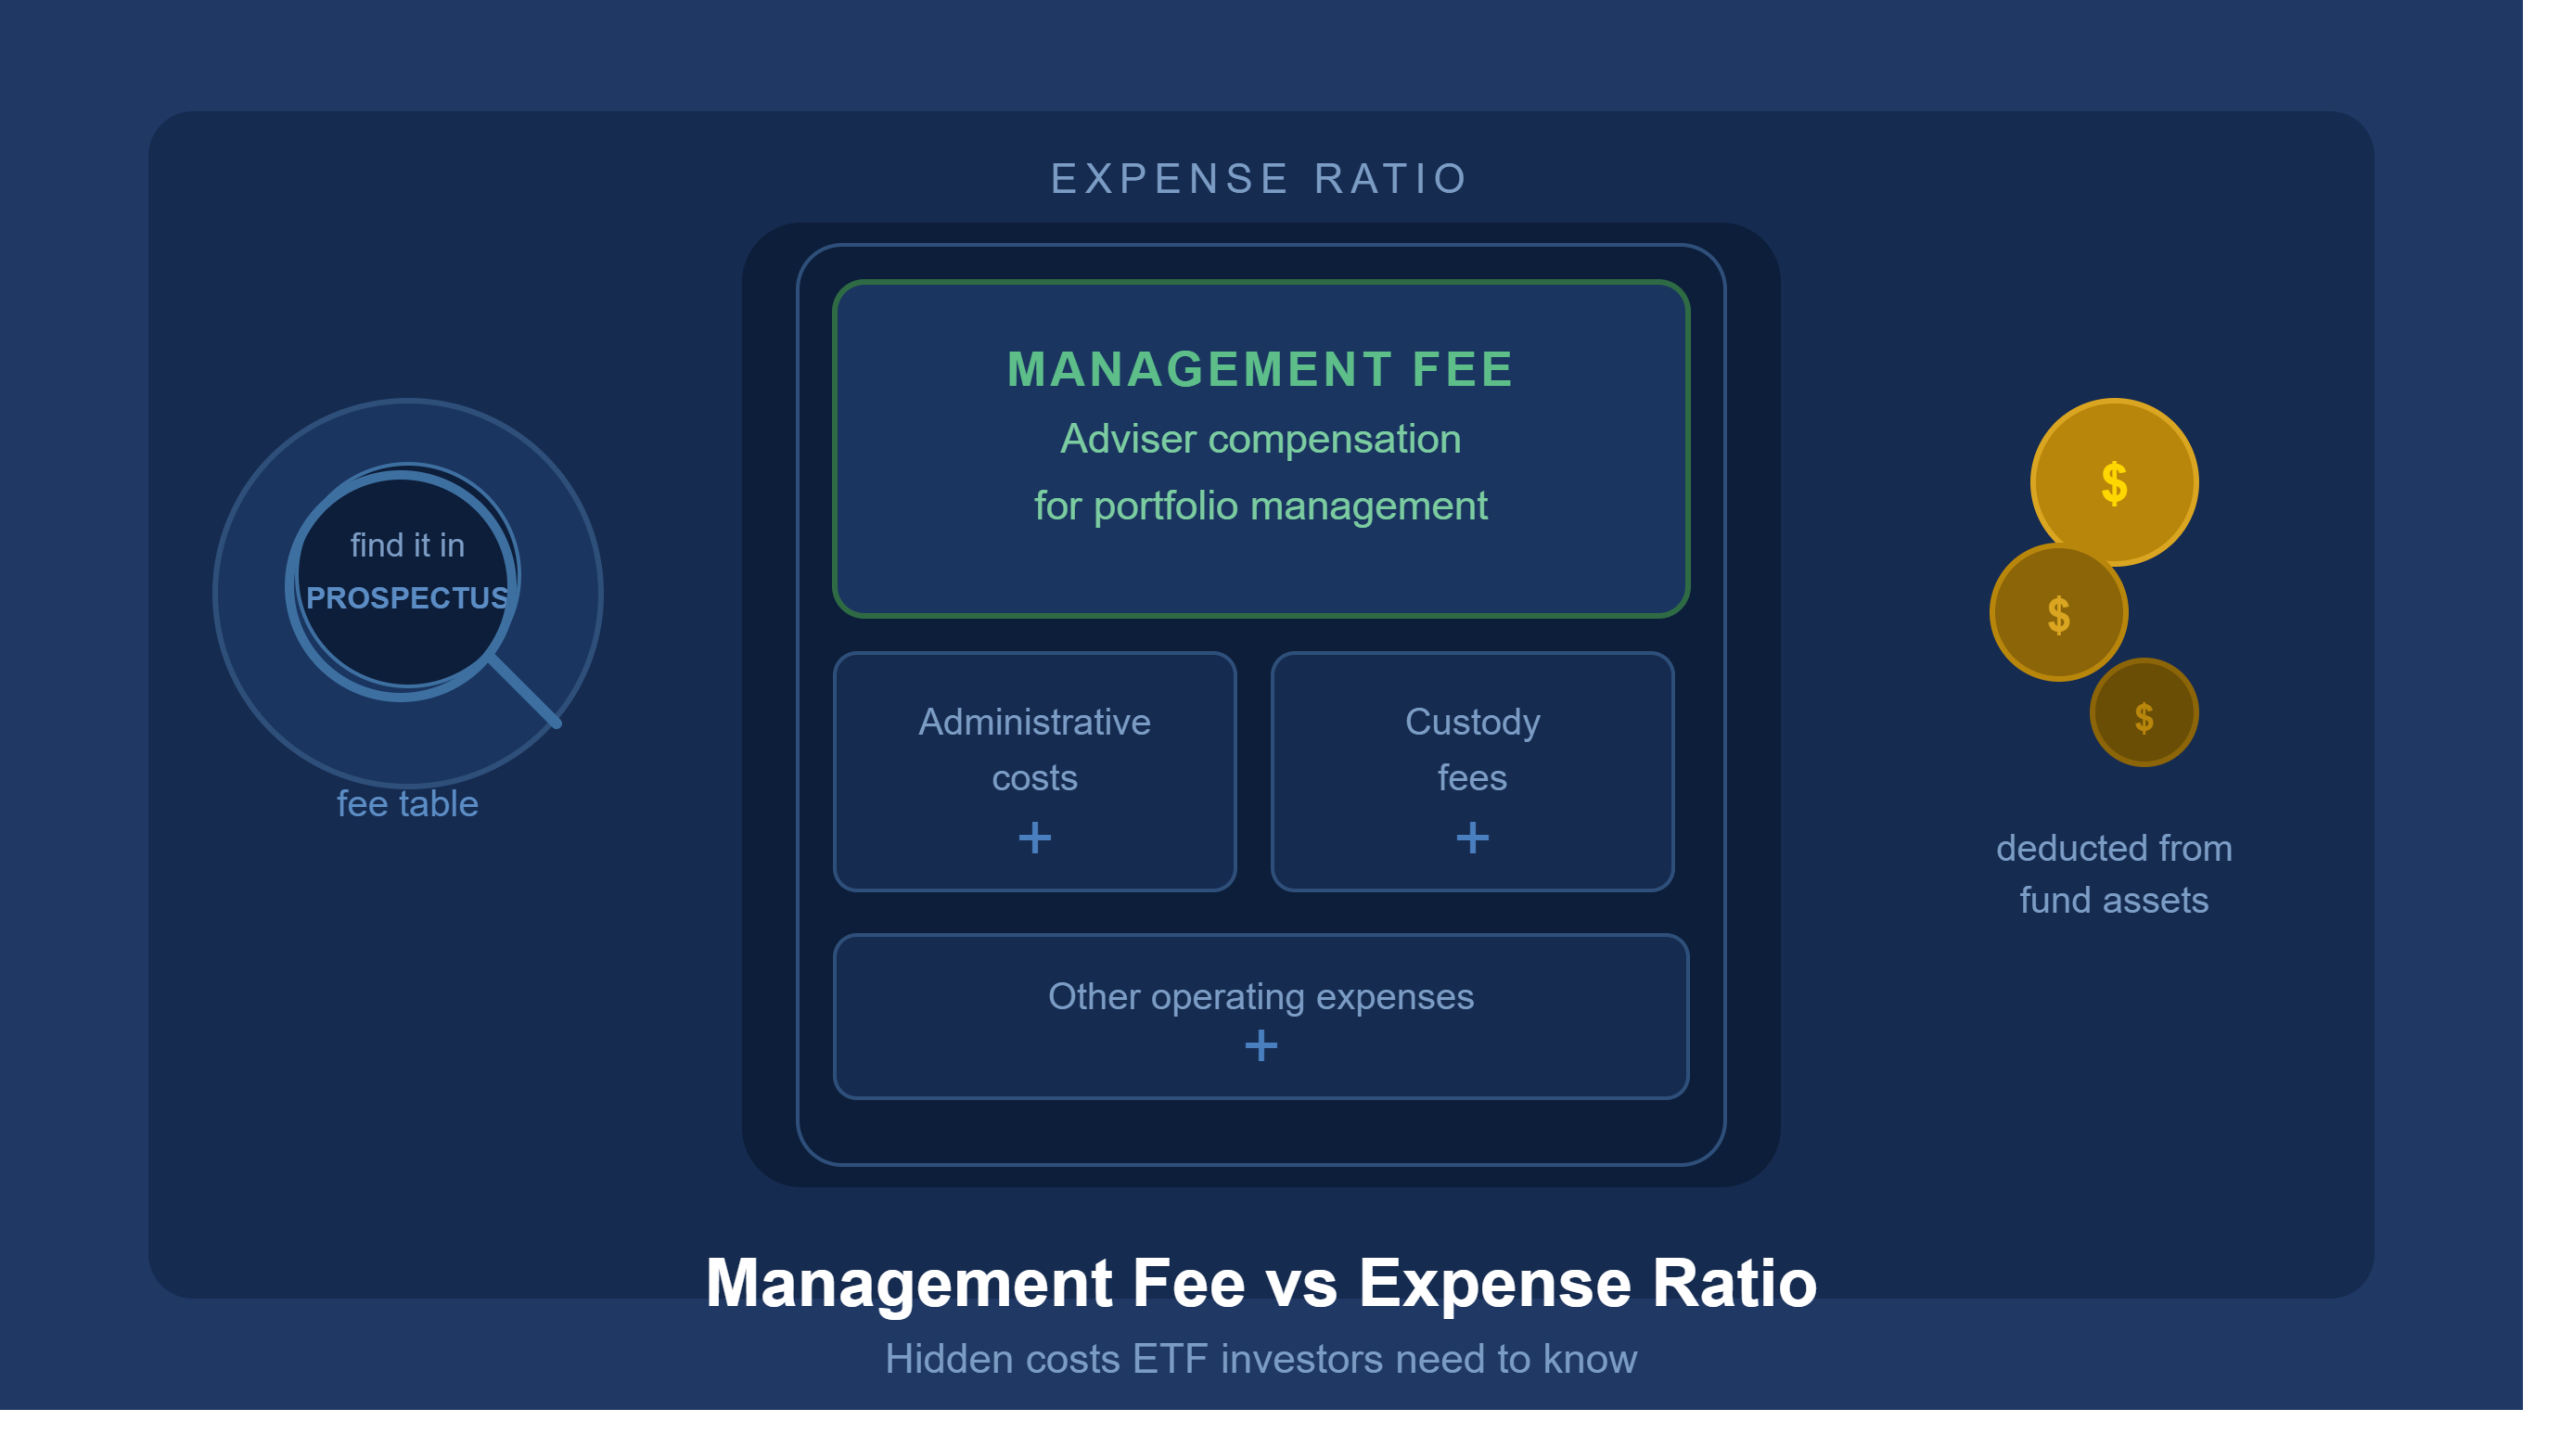
Yield alone should not drive fund selection. Funds with yields well above the market average may be experiencing price deterioration that artificially inflates the yield figure. Selecting dividend index funds with consistent payout histories, manageable expense ratios, and technically sound chart structures produces more reliable income over time.
Optimizing Your Index Fund Strategy with Above the Green Line Tools
ATGL’s proprietary scanning and charting tools are designed to identify rotation opportunities in real time. Members gain access to relative strength rankings, moving average overlays, and buy/sell zone indicators across a broad universe of index funds with dividends and growth-focused alternatives.
Rather than relying on economic forecasts or market sentiment, ATGL’s methodology grounds decisions in price behavior and quantifiable metrics. This approach applies consistently across market cycles, positioning investors to act on data rather than speculation. To access live technical charts, relative strength indicators, and systematic rotation frameworks, join the Above the Green Line community.

Related Articles
[pt_view id=”fb2451fm3r”]