Above the Green Line -01
  • Market Insights
        • Commentary
          • Daily
          • Weekly
        • BUY / SELL SIGNALS
          • Trade Posts
          • Recent Trade Alerts
          • Recent Day Trades
        • BLOGROLL
          • Dividend Growth Blog
          • ETF Sector Blog
          • Dow Dogs
          • TPOW Blog
  • Strategies
        • SWING TRADING
          • Current Positions
          • Watchlists
          • Closed Positions
          • Candidates - TOP 100
          • Specialty Stocks
        • WEEKLY STOCK PICK
          • TPOW Charts
          • TPOW Performance
          • TPOW Strategy Guide
          • TPOW Performance Dashboard
        • DAY TRADING
          • Watch List
        • ATGL DASHBOARD
        • ETF STRATEGIES
          • ETF Sector Rotation
          • ETF Sector Portfolio
        • DIVIDEND GROWTH
          • Dividend Growth Portfolio
          • Dividend Calendar
        • DOGS OF THE DOW
          • Dogs of the Dow Portfolio
          • DOW 5 Portfolio
  • Markets
        • US MARKET
          • Commodities
          • Energy
          • Precious Metals
          • Volatility
        • GLOBAL MARKETS
          • Market Indices
          • Economic Calendar
          • FOREX Heat Map
          • FOREX Cross Rates
          • Crypto Currency Market
  • Investing
    • Discord Community
    • Dashboard
  • Resources
        • ARTICLES
          • Dividend Growth Model Articles
          • ETF Articles
          • Investment Strategies Articles
          • Market and Economic Insights
          • Stock Trade Articles
          • Stock Reviews
        • TOOLS
          • Stock Scanners
          • Charting Software
          • Brokerage Firms
        • STOCK CHARTS
          • Key Components
          • Reading Charts
          • Drawing Stock Charts
          • Identifying Trends
        • RETIREMENT PLANNING
  • About
    • Contact Us
    • How to Win
    • #1 At Stockcharts
    • Disclaimer
    • FAQ
  • Log In
  • Subscribe

Day Trading

DT image

Day Trading

Please join us during Market hours at the Live Stream on YouTube. to watch and learn. Day trading takes your time during the day.

Day Trading Alerts will be sent out with Discord Trading Hub. and on our Live Trading Room. Please install a free Discord app.

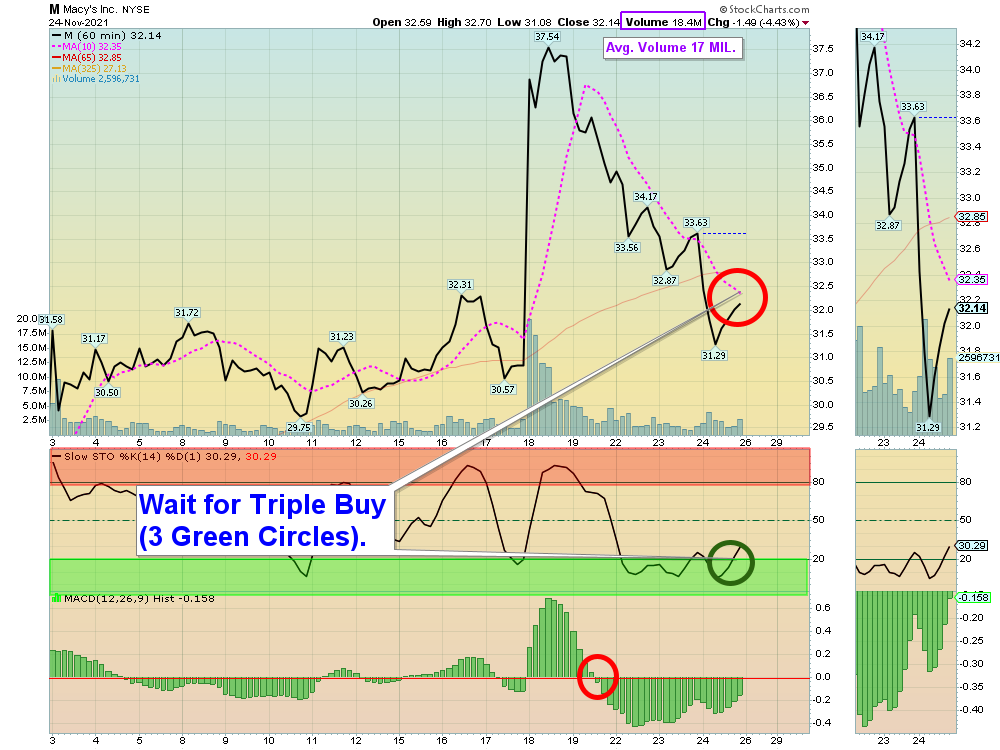
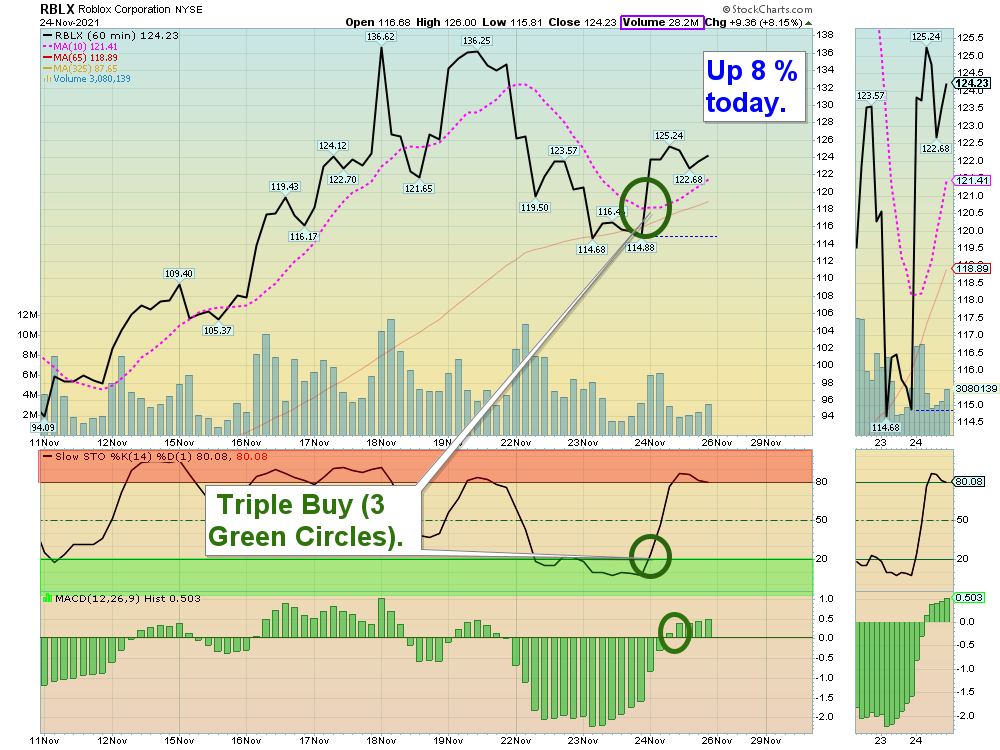
Or we have another simple system for you:   TRIPLE BUYS.

Find Charts below with Red Circles and WAIT for them to change to 3 Green Circles.
Then BUY immediately!  EXIT if the Stock falls below the Pink Dotted Line (10-hour average).
Keep refreshing the page for updated “Real Time” Charts. Works best when the Volume is High.

This List should be used to help you find the High-Volume stocks that could pop up 5 – 15 % today, or in the next day or so (Based on a Triple Buy Signal). The 3 Green Circles create a “Triple Buy” Signal. Learn more about “Triple Buys”. The normal Green Line Rules are not required here.

Sample Charts:

M Chart

RBLX Chart

Day Trading Charts in Side by Side View.

More on Day Trading.

What is Day Trading? The basic definition is the buying and selling of securities on the same day, often online, on the basis of small, short-term price fluctuations. There was once a time when the only people who were able to trade actively in the stock market were those working for large financial institutions, brokerages, and trading houses. However, with the rise of the internet and online trading houses, it’s become easier for the average individual investor to get in on the game.

Day trading can turn out to be a very lucrative career (as long as you do it properly). But it can also be a little challenging for novices—especially for those who aren’t fully prepared with a well-planned strategy. Even the most seasoned day traders can hit rough patches and experience losses. So, what exactly is day trading and how does it work?

Stocks currently “On Deck” for potential Day Trading are shown on our Day Trading Watch List and Scrolling Charts which can be accessed by clicking on hyperlinks in the Day Trading Table below.

DAY TRADING
Watchlist and Charts
Strongest Stocks ListStrongest Stocks Charts
Banana Hunt ListBanana Hunt Charts

KEY TAKEAWAYS

  • Day traders are active traders who execute intraday strategies to profit off of price changes for a given asset.
  • Day trading employs a wide variety of techniques and strategies to capitalize on perceived market inefficiencies.
  • Day trading is often characterized by technical analysis and requires a high degree of self-discipline and objectivity.

The Basics of Day Trading
Day trading usually refers to the practice of purchasing and selling a security within a single trading day. While it can occur in any marketplace, it is most common in the foreign exchange (forex) and stock markets. Day traders are typically well-educated and well-funded. They use high amounts of leverage and short-term trading strategies to capitalize on small price movements that occur in highly liquid stocks or currencies.

Day traders are attuned to events that cause short-term market moves. Trading based on the news is a popular technique. Scheduled announcements such as economic statistics, corporate earnings, or interest rates are subject to market expectations and market psychology. Markets react when those expectations are not met or are exceeded–usually with sudden, significant moves–which can greatly benefit day traders.

Stocks currently “On Deck” for potential Day Trading are shown on our Day Trading Watch List and Scrolling Charts which can be accessed by clicking on hyperlinks in the Day Trading Table below.


DAY TRADING
Watchlist and Charts

Strongest Stocks ListStrongest Stocks Charts
Banana Hunt ListBanana Hunt Charts

Please send some profits to help animals (ASPCA).

Subscribe to Our Newsletter

AGL Logo

Get our eBook Now!

Candlestick - A Swing Traders Friend

We don’t spam! Read our privacy policy for more info.

You’ve been successfully subscribed to our newsletter!

Voted #1 at Stock Charts

SH Chart
Inverse S&P 500 Fund (SH) will have a Money Wave Buy today.

Help Us Help Animals

Help Us Help Animals

Recent Comments

  • Market Breadth Indicators: A Trader’s Guide to Early Trend Detection on Backtesting: Definition and How a Trading Strategy Backtest Works
  • Island Reversal Pattern: Definition and Formation Explained on Double Top Pattern: How to Identify and Trade This Reversal Signal
  • Channel Pattern Guide: What It Is and Why It Matters on A Guide to Forecasting Using Moving Averages
  • What Is a Broadening Bottom Chart Pattern? Full Guide on Bull vs. Bear Market: An Investor’s Guide to Market Phases
  • ATGL Weekly Money Flow - 2025-05-11 on ATGL Top Pick of the Week! Apr 6, 2025

Become a Green Liner!

Help me make more Money in the Stock Market.

ON ATGL

  • DashBoard
  • Weekly Commentary
  • Daily Buy / Sell Signals
  • Day Trade Setup
  • Trading Rooms

Design & Develop By Pixelvect

STRATEGIES

  • Swing Trading
  • ATGL Pick of the Week
  • Dividend Growth
  • ETF Sector Rotation
  • Dogs of the Dow

HELP

  • ATGL Trading Rules
  • FAQ
  • Account Maintenance
  • Contact US
  • Join

FOLLOW US

Instagram Linkedin Twitter Facebook

© COPYRIGHT 2024 · ABOVETHEGREENLINE.COM · ALL RIGHTS RESERVED · PRIVACY · TERMS · CONTACT · WATCHLIST · CURRENT