By ATGL
Updated March 14, 2026
Forecasting market trends is essential for optimizing your investment strategies. Whether you are an investor, day trader, financial advisor, or swing trader, leveraging technical analysis tools like moving averages can significantly enhance your decision-making process. Moving averages help smooth out price data, making it easier to identify trends and potential turning points in the market.
In this guide, you’ll learn about different types of moving averages and how to use them effectively for stock trading and forecasting future values.
Analytical tools like moving averages help investors evaluate trends and refine the timing of their investment decisions. Readers who want to understand how these analytical methods fit into broader portfolio planning and market approaches can review the Investment Strategies Guide, which outlines the core principles behind developing effective investment strategies.
What Are Moving Averages?
Moving averages are statistical tools used in technical analysis to help adjust price data by creating a constantly updated average price. This allows investors, day traders, financial advisors, and swing traders to more easily identify the direction of the trend over a specified period of time. By filtering out the noise from random price fluctuations, moving averages provide a clearer picture of the overall market trend.
Types of Moving Averages Used To Forecast Market Trends
You can use different types of moving averages to forecast market trends, as each one has a unique calculation method and application. Understanding these variations allows you to choose the most appropriate tool for your specific trading strategy.
Simple Moving Average
The Simple Moving Average (SMA) is one of the most straightforward and widely used types of moving averages in technical analysis. You calculate it by taking the arithmetic mean of a given set of prices over a specific number of periods.
This is the simple average formula:
SMA = (P1 + P2 + P3 + … + Pn) / n
Where:
- P = Price at each period
- n = Number of periods
The SMA is useful for identifying the direction of the trend and potential support and resistance levels.
Exponential Moving Average
The Exponential Moving Average (EMA) improves upon the SMA by giving more weight to recent prices, making it more responsive to new information. This allows the EMA to react more quickly to price changes and is useful for short-term trading strategies.
The EMA is calculated using the following mathematical formula:
EMA_today = (Price_today * Multiplier) + (EMA_yesterday * (1 – Multiplier))
Where the Multiplier is calculated as:
Multiplier = 2 / (n + 1)
This recursive calculation method guarantees that the EMA places greater emphasis on the most recent price data, making it a more dynamic tool for identifying trends and potential market reversals.
Double Exponential Moving Average
The Double Exponential Moving Average (DEMA) reduces the lag found in traditional moving averages like the SMA and EMA.
The DEMA is calculated as follows:
DEMA = 2 * EMA – EMA(EMA)
In this formula:
- EMA represents the Exponential Moving Average.
- EMA(EMA) is the EMA of the EMA itself.
By applying a smoothing factor twice, the DEMA provides a more responsive indicator that closely follows price movements, making it practical for short-term trading strategies.
Triple Exponential Moving Average
The Triple Exponential Moving Average (TEMA) goes a step further than the DEMA by applying the exponential smoothing three times.
The TEMA is calculated using the following formula:
TEMA = 3 * EMA – 3 * EMA(EMA) + EMA(EMA(EMA))
In this formula:
- EMA is the Exponential Moving Average.
- EMA(EMA) is the EMA of the EMA.
- EMA(EMA(EMA)) is the EMA of the EMA of the EMA.
The TEMA helps eliminate minor fluctuations and enhances the clarity of the trend direction. Its ability to smooth out short-term fluctuations while retaining sensitivity to price movements makes it an excellent choice for both short-term and long-term trading strategies.
Weighted Moving Average
The Weighted Moving Average (WMA) assigns greater importance to recent prices while giving less weight to older data points. This makes the WMA more responsive to recent price changes compared to the SMA, which treats all data points equally.
The WMA is calculated by multiplying each price point by a predetermined weight and then summing these products. The total is divided by the sum of the weights. The formula for a WMA over n periods is:
WMA = (P1 * W1 + P2 * W2 + … + Pn * Wn) / (W1 + W2 + … + Wn)
Where:
- P = Price at each period
- W = Weight for each period, typically with the most recent period having the highest weight
The WMA is purposeful for identifying short-term trends and potential reversal points because it reacts more quickly to recent price movements. This makes it a valuable tool for swing traders and day traders who need to make quick decisions based on the latest market data.
Tips on How To Use MA for Stock Trading and Forecasting
You can use moving averages to determine the overall direction of the market. A rising moving average indicates an uptrend, while a falling moving average suggests a downtrend. For long-term trends, use longer periods (e.g., 200-day SMA), and for short-term trends, use shorter periods (e.g., 50-day EMA). Adapt the periods of your moving averages based on the market’s volatility. In a highly volatile market, shorter-period moving averages may be more effective, while in a stable market, longer-period moving averages can provide clearer signals.
Pay attention to crossover signals where a short-term moving average crosses a long-term moving average. A common strategy is the Golden Cross, where the 50-day SMA crosses above the 200-day SMA, indicating a bullish trend. Conversely, the Death Cross occurs when the 50-day SMA crosses below the 200-day SMA, signaling a bearish trend.
Moving averages can also act as dynamic support and resistance levels. Prices often bounce off the moving average lines, providing entry and exit points. For example, if a stock price is above the 50-day SMA, it might find support at this level during pullbacks.
Use multiple moving averages to gain a more comprehensive view of the market. Combining different types, like SMA and EMA, can provide insights into both long-term and short-term trends. This can help you confirm signals and reduce the risk of false positives. Additionally, Fibonacci moving averages are also helpful in identifying key support and resistance levels, enhancing your ability to make accurate forecasts.
Find the Technical Indicators and Charts You Need To Succeed
Mastering moving averages and incorporating them into your trading strategy is a vital step toward successful market forecasting.
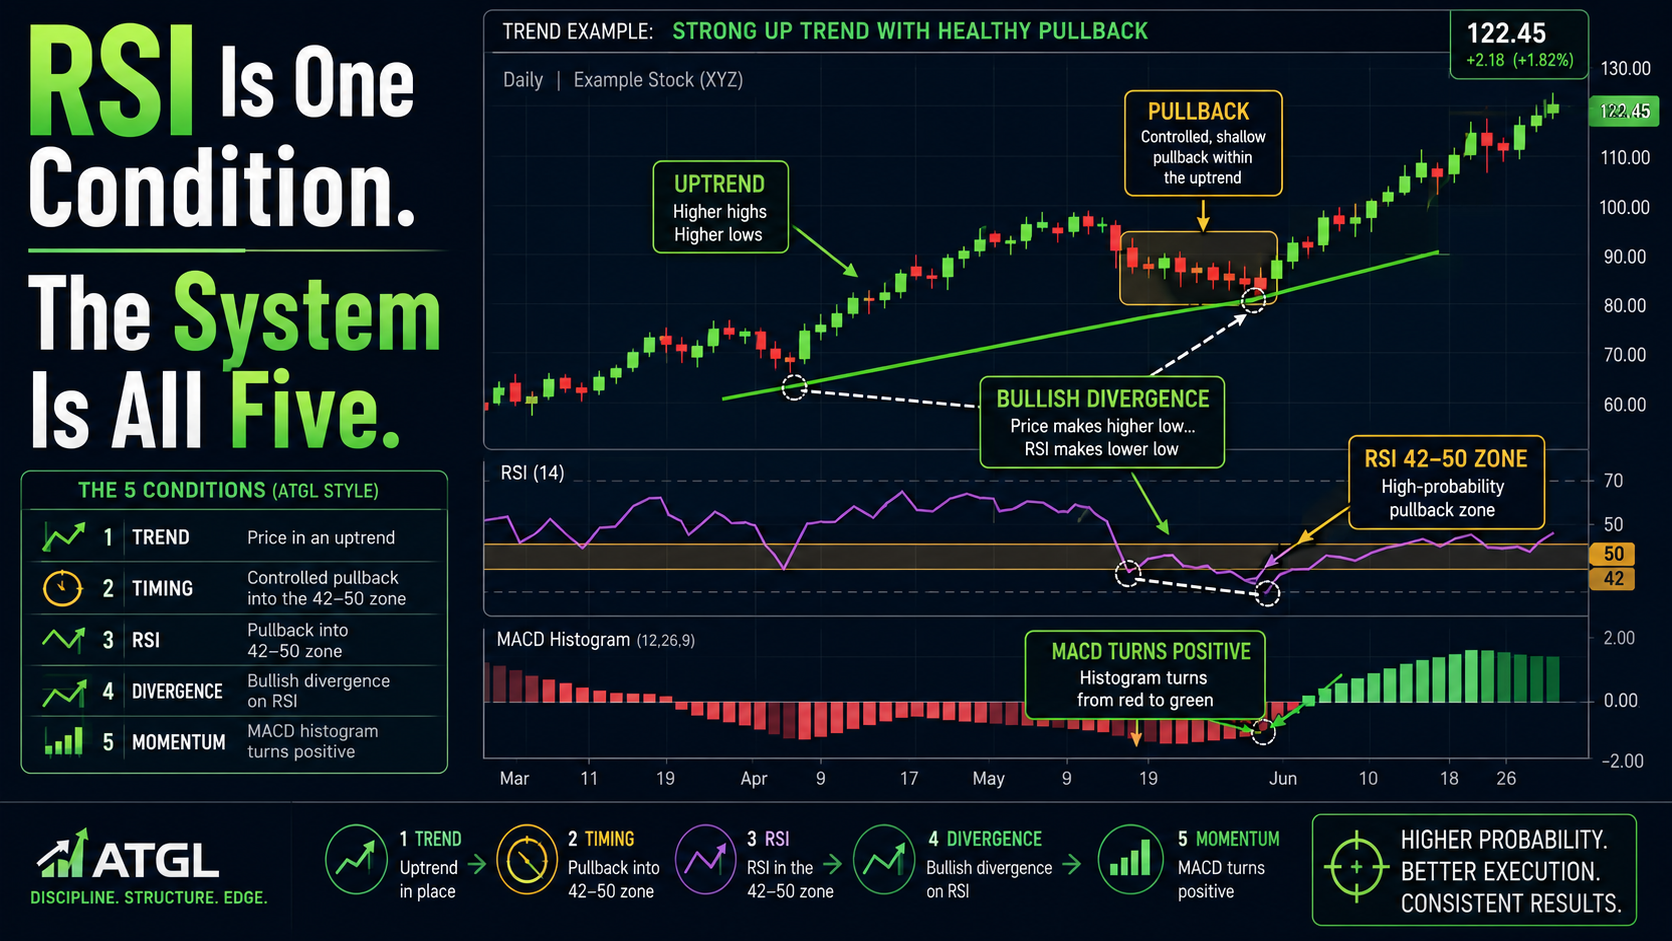
However, moving averages are just one piece of the puzzle. To truly excel in stock trading, you need to utilize a comprehensive set of technical indicators and charts. Tools like the Relative Strength Index, Moving Average Convergence Divergence), and various volume indicators can provide additional layers of insight, helping you confirm trends and make more accurate predictions.
At Above the Greenline, we offer a wide range of resources and proprietary metrics to help you identify the best investment opportunities. Our technical charts highlight key indicators, including moving averages, stochastic indicators, and volume, with detailed annotations to pinpoint potential buy and sell points. Whether you are an investor, day trader, financial advisor, or swing trader, our tools enhance your trading strategy and boost your market performance.
Unlock your potential and elevate your trading skills by exploring our comprehensive suite of technical analysis tools. Join Above the Greenline today and gain access to the expert insights and resources you need to succeed in the world of stock trading.

Related Articles
[pt_view id=”9b64b383ox”]