By Andrew Stowers
Updated May 3, 2026
Most investing advice during a recession is the same: don’t panic, stay invested, think long term. That advice is correct — but it’s incomplete.
The investors who not only survive recessions but genuinely improve their long-run position do three things differently: they understand what is happening and why, they know which assets hold value and which collapse, and they act systematically rather than reactively.
This guide gives you all three — a clear framework for understanding recession dynamics, a phase-aware positioning strategy that generic advice never provides, and a specific breakdown of what to buy, what to avoid, and how to sequence your decisions when markets turn. After reading this article, we recommend you explore our Investment Strategy Guide for more resources on how to best manage your investment portfolio.
What Is a Recession — and What Happens to Markets During One?
| Quick Answer
A recession is defined as two consecutive quarters of negative GDP growth. U.S. stock markets typically begin declining before an official recession is declared — often 6–12 months earlier — and begin recovering before GDP growth resumes. Investors who wait for official confirmation to adjust positioning are almost always late in both directions. |
The official arbiter of U.S. recessions is the National Bureau of Economic Research (NBER), which uses a broader definition than the two-consecutive-quarters rule — considering factors including income, employment, industrial production, and retail sales. The practical implication: by the time a recession is officially declared, markets have often already priced in much of the economic deterioration.
How Markets Lead the Economy
The stock market is a forward-looking mechanism — it prices in anticipated future earnings, not current economic conditions. This creates a consistent pattern across historical recessions: equity markets begin declining approximately 6–12 months before an official recession is declared, and begin recovering 6–12 months before GDP growth resumes. The economy is always the last indicator to confirm what markets already knew.
This has a critical practical implication: investors who wait for the economic ‘all-clear’ before re-engaging miss the early recovery phase — which historically delivers the strongest returns of any cycle phase.
Historical Context: Drawdowns and Duration
Post-WWII U.S. recessions have lasted an average of approximately 10 months, ranging from 2 months (2020 COVID recession) to 18 months (2007–2009 Great Recession). The average S&P 500 peak-to-trough decline during these recessions has been approximately 30–35%, ranging from roughly -20% in mild recessions to -57% in 2008–2009.
The inverted yield curve — when short-term Treasury yields exceed long-term yields — has preceded every major U.S. recession in the post-WWII era, typically by 6–24 months. Monitoring yield curve shape is among the most reliable early-warning signals available to investors.
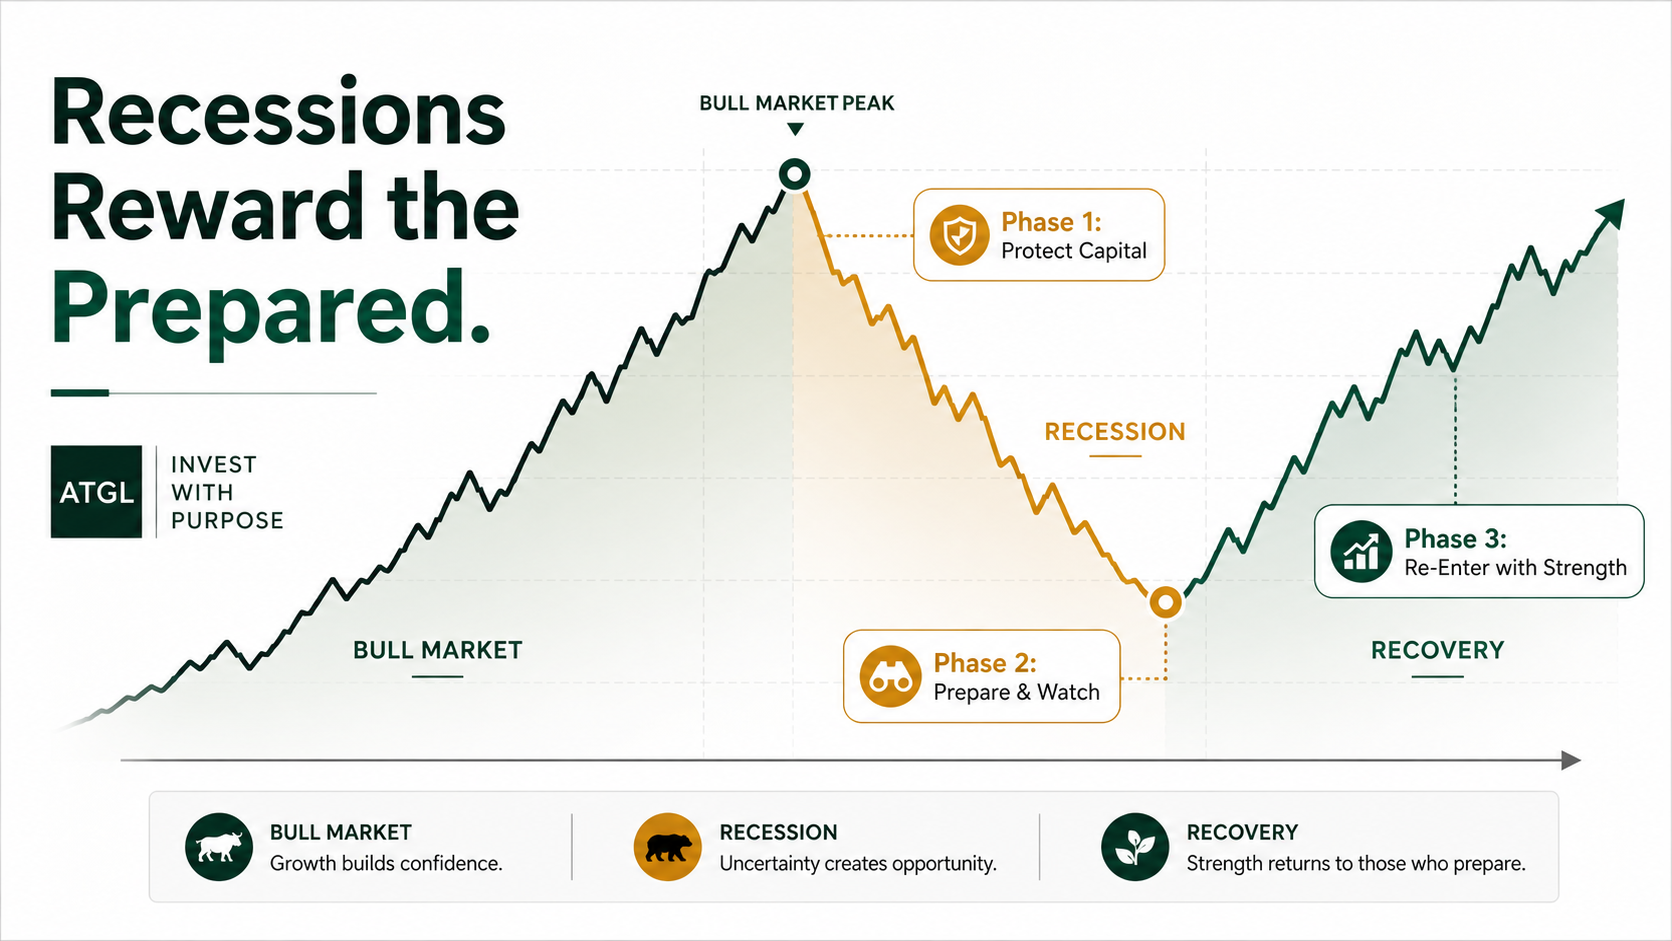
The Three Phases of a Recession — and Why Each Requires a Different Approach
| ATGL’s Phase Framework
A recession is not a single homogeneous event. It has three distinct investment phases: early recession (defensive rotation), deep recession (maximum preservation with selective buying), and recovery (rotate to growth before data confirms). Treating all three phases identically is one of the most common and costly recession-investing mistakes. |
This three-phase framework is what separates a disciplined investor’s recession response from a reactive one. Each phase has distinct market characteristics, distinct risk/return opportunities, and distinct positioning implications.
Phase 1: Early Recession — Defensive Rotation
The early recession phase typically begins before the official declaration — often when the yield curve inverts or flattens, when leading indicators (jobless claims, PMI, consumer confidence) begin deteriorating, and when credit spreads start widening.
The appropriate response: reduce exposure to cyclical sectors (financials, materials, consumer discretionary, industrials) that are most sensitive to economic slowdown. Increase allocation to defensive sectors (consumer staples, healthcare, utilities), short-duration government bonds, and cash. This is not panic — it is deliberate pre-positioning before the worst of the decline.
Phase 2: Deep Recession — Maximum Preservation and Selective Buying
The deep recession phase is characterised by peak unemployment, maximum market pessimism, and widest credit spreads. Corporate earnings are at or near their cyclical trough. Market sentiment is at extremes. This is simultaneously the most uncomfortable time to invest and historically the highest-return entry point for patient capital.
The appropriate response: continue systematic dollar-cost averaging into broad market ETFs. Deploy accumulated cash reserves in tranches — at 20%, 30%, and 40% drawdown levels — into high-quality equities and long-duration Treasury bonds (which benefit as rates peak and begin to decline). Avoid trying to identify the exact bottom; buy the process, not the price.
Phase 3: Recovery — Rotate Early, Before the Data Confirms
The recovery phase begins — as noted — before economic data confirms it. Leading indicators improve before GDP turns positive: jobless claims peak and begin declining, PMI bottoms, credit spreads narrow, and equity markets begin a sustained advance.
The appropriate response: rotate from defensive to cyclical exposure — increasing allocation to sectors that benefit most from economic re-acceleration (financials, industrials, materials, consumer discretionary). Reduce long-duration bond weighting as the prospect of rising rates returns with economic growth. Maintain the core broad-market DCA discipline.
Asset Classes and Strategies That Hold Up in Recessions
Not all assets fall equally during recessions. Understanding which categories have demonstrated relative resilience — and why — allows for more deliberate positioning rather than blanket defensive moves.
U.S. Treasury Bonds
During recession-driven equity sell-offs, investors historically flee to the safety of U.S. government debt, driving Treasury prices up and yields down. Long-duration Treasuries (TLT, VGLT) have delivered strong positive returns during several major recessions precisely when equities were falling hardest. The mechanism: falling rates + flight-to-quality demand = rising bond prices.
Consumer Staples
Companies producing food, beverages, household products, and personal care items — Procter & Gamble, Coca-Cola, Walmart — maintain relatively stable demand through economic downturns. Consumers cut discretionary spending before they cut necessities. The Consumer Staples Select Sector SPDR (XLP) is the primary vehicle for this exposure.
Healthcare
Healthcare demand is largely inelastic — people don’t defer essential medical care during recessions. Pharmaceutical companies, healthcare providers, and medical device manufacturers maintain relatively stable revenue through economic cycles. VHT (Vanguard Health Care ETF) or XLV (Health Care Select SPDR) provide this exposure.
Utilities
Utility companies operate regulated businesses with predictable, contracted revenue streams — consumers continue paying electricity, gas, and water bills regardless of economic conditions. Their stable dividends also provide income buffer during periods of equity price declines. XLU (Utilities Select SPDR) is the standard vehicle.
Dividend-Paying Stocks
Companies with long histories of consistent dividend payments — particularly Dividend Aristocrats with 25+ consecutive years of increases — tend to hold value better during recessions than the broader market. The dividend income provides a return component that partially offsets price declines. VYM (Vanguard High Dividend Yield ETF) or SCHD (Schwab U.S. Dividend Equity ETF) provide diversified dividend exposure.
Gold
Gold has historically served as a safe-haven asset during periods of financial system stress and extreme uncertainty. Its correlation with equities is typically low to negative during acute crisis events — GLD and IAU are the standard ETF vehicles. Note: gold’s performance is most reliable during severe financial system stress (2008) and less consistent during ordinary recessions where credit markets remain functional.
| Asset Class | 2001 Recession | 2008–09 Recession | 2020 Recession | Typical Role |
|---|---|---|---|---|
| S&P 500 | ~-30% | ~-57% | ~-34% (brief) | Broad market |
| Long-Term Treasuries | ~+15% | ~+25% | ~+20% | Flight to quality |
| Consumer Staples | Outperformed | Outperformed | Outperformed | Defensive core |
| Healthcare | Outperformed | Outperformed | Outperformed | Defensive core |
| High-Yield Bonds | ~-25% | ~-35% | ~-20% | Avoid — equity-like |
| Gold | ~+15% | ~+25% | ~+25% | Crisis hedge |
Historical figures are approximate and for illustrative context only. Past performance does not predict future results. Source data varies by measurement period and index used.
What to Avoid: Common Mistakes That Cost Investors the Most
A clear picture of what not to do during a recession is at least as valuable as knowing what to buy. The following mistakes are not theoretical — they are the documented patterns that most severely damage investor outcomes across economic downturns.
1. Panic Selling at or Near the Bottom
The single most destructive recession behaviour is liquidating equity positions at or near the market trough — locking in losses permanently and missing the recovery. Academic research on retail investor behaviour consistently shows that the average retail investor significantly underperforms the benchmark index over full market cycles, primarily due to selling during downturns and buying near peaks.
The antidote: pre-defined rules about what conditions would justify selling (not ‘portfolio is down 30%’ but ‘company fundamentals have permanently deteriorated’). Broad-market index ETFs have no reason to be sold during recessions — the economy and markets always recover.
2. High-Yield Bonds — A Counterintuitive Warning
High-yield bond ETFs are not a safe haven during recessions. When credit markets deteriorate, corporate default rates rise and credit spreads widen dramatically — high-yield ETFs (HYG, JNK) sell off in a pattern that closely resembles equities. In 2008–2009, high-yield bonds fell approximately 35%. They do not provide the diversification benefit that government bonds or investment-grade fixed income deliver.
3. Highly Leveraged Companies
Companies with high debt loads face refinancing risk when credit markets tighten during recessions. Rising credit spreads increase borrowing costs; falling revenues reduce debt service capacity. Leveraged buyout vehicles, heavily indebted cyclical companies, and firms with near-term debt maturities are the first casualties when financial conditions tighten.
4. Speculative Growth Stocks
Unprofitable companies relying on future cash flows discounted at low rates are hit hardest when both earnings expectations fall and discount rates rise simultaneously. The 2022 experience (not technically a recession but a severe repricing) demonstrated how violently high-multiple, negative-earnings stocks are re-rated when the risk-free rate rises. These positions should be reduced before or early in a recession, not during its trough.
5. Trying to Time the Exact Bottom
The bottom is only identifiable in retrospect. Investors who wait for the ‘all-clear’ before re-engaging consistently miss the early recovery phase — which, as noted, occurs before economic data confirms improvement. Systematic dollar-cost averaging eliminates the timing problem entirely: you buy throughout the decline at lower average prices without needing to identify the precise trough.
Dollar-Cost Averaging and Systematic Investment During Downturns
| The Most Reliable Recession Strategy
Dollar-cost averaging — investing a fixed dollar amount at regular intervals regardless of market price — is the most broadly applicable recession investment strategy. By continuing to invest systematically through a downturn, you automatically purchase more shares at lower prices, reducing your average cost basis and improving long-run returns without requiring any market timing. |
How DCA Works During a Recession
The mechanics are simple: invest a fixed amount on a fixed schedule — weekly, bi-weekly, or monthly — regardless of what the market is doing. When prices are lower, your fixed dollar amount buys more shares. When prices are higher, it buys fewer. The average cost per share is always lower than the time-weighted average price over the same period.
Applied to a recession: an investor contributing $1,000 per month to a broad market ETF during a 12-month recession acquires significantly more shares per dollar than the same investor would at pre-recession prices. When the recovery arrives, those additional shares appreciate — and the investor who kept buying through the decline captures returns that the investor who stopped does not.
The Cash Reserve Component
DCA works best when complemented by a pre-built cash reserve — typically 10–20% of investable assets accumulated before or early in a recession. This reserve provides the capacity for opportunistic deployment at significant drawdown levels (20%, 30%, 40%+) on top of the systematic contributions. The reserve is not held indefinitely — it is deployed in deliberate tranches as prices fall to increasingly attractive levels.
Why DCA Outperforms Timing
The behavioural advantage of DCA is as important as the mathematical one. By automating regular investments, you remove the agonising decision of ‘is now a good time to invest?’ from the equation entirely. The answer is always yes, because the process is rule-based rather than discretionary. Emotional decision-making during market stress is the primary driver of the gap between market returns and actual investor returns — DCA closes much of that gap by design.
How to Position Your Portfolio for a Recession: A Rules-Based Framework
The following framework translates the phase-aware recession strategy into specific, actionable portfolio decisions. It is designed to be implemented systematically — not reactively when the recession is announced, but proactively as early warning signals emerge.
Pre-Recession Preparation (When Leading Indicators Deteriorate)
- Build a 10–20% cash reserve from profits or contributions — this is the deployment fuel for Phase 2
- Increase allocation to short-duration government bonds (SHY, VGSH) — reduce interest rate risk while maintaining capital
- Increase defensive sector weighting (consumer staples XLP, healthcare XLV, utilities XLU) in equity allocation
- Reduce or eliminate speculative growth and heavily leveraged positions — the time to exit is before the decline, not during it
- Maintain broad-market core ETF positions — the core is not dismantled, only the satellite is repositioned
During Recession — Deep Phase (Phase 2 Positioning)
- Continue automatic DCA contributions to broad-market ETFs without interruption — this is non-negotiable
- Deploy cash reserve in tranches: first tranche at -20%, second at -30%, third at -40% from peak
- Add long-duration Treasury exposure (TLT, VGLT) if yields are elevated and likely to decline as the Fed pivots
- Avoid high-yield bonds — they are equity-correlated in recessions and do not provide defensive characteristics
- Review — not panic-sell — individual positions for fundamental deterioration vs simply price decline
Recovery Positioning (Phase 3 — Before Economic Data Confirms)
- Monitor leading indicators: jobless claims peak and declining, PMI bottoming, credit spreads narrowing — these signal the turn
- Rotate from defensive sectors to cyclicals (financials, industrials, materials, consumer discretionary) in the satellite allocation
- Reduce long-duration bond weighting as rate-rise risk returns with economic recovery
- Do not wait for GDP growth confirmation — the market recovery will be well underway before official data confirms it
| The Monitoring Signals
Watch these four leading indicators for phase transitions: Yield curve: steepening from inverted signals late recession |
Recessions Reward the Prepared
Recessions are not purely threats to endure — they are also the periods that most reliably separate disciplined investors from reactive ones. The investors who come through recessions with their capital intact and their long-run compounding accelerated are those who prepared before, acted systematically during, and rotated early in the recovery.
The framework in brief:
- Markets lead the economy — act before the official declaration, not after
- Three phases require three different responses: rotate defensive early, buy selectively at the bottom, rotate back to growth before the data confirms
- Asset classes that hold up: Treasuries, consumer staples, healthcare, utilities, dividend payers — not high-yield bonds
- Dollar-cost average without interruption — it is the most reliable recession strategy for most investors
- Avoid panic selling, high-yield bonds, leveraged companies, and precision timing — these are the four most costly mistakes
Recessions test every investor’s process. Those with a rules-based, systematic approach find them manageable. Those without one find them devastating. ATGL’s complete system is built to function across every market environment — not just the easy ones.
| Navigate Every Market Cycle With ATGL
At AboveTheGreenLine.com we give investors a rules-based system for every market environment — bull market, bear market, recession, and recovery. The discipline is the same regardless of economic conditions. If you want the complete framework, join us Above the Green Line. |
Frequently Asked Questions
What happens to my investments during a recession?
During recessions, equity markets typically decline — the average S&P 500 peak-to-trough drawdown in post-WWII recessions is approximately 30–35%. However, markets begin declining before the official recession is declared and begin recovering before GDP growth resumes. High-quality bonds, consumer staples, healthcare, and utilities typically outperform the broader market during recessions, though most asset classes experience some pressure.
Is it a good time to buy stocks in a recession?
Recessions historically represent some of the best long-term buying opportunities in equity markets — prices have fallen significantly and future returns from those lower prices are higher. The challenge is that the bottom is never identifiable in real time. Dollar-cost averaging — investing fixed amounts at regular intervals — captures the benefit of lower prices throughout the downturn without requiring precise timing.
How long do recessions last?
Post-WWII U.S. recessions have averaged approximately 10 months in duration, ranging from 2 months (2020 COVID recession) to 18 months (2007–2009 Great Recession). Stock market recoveries typically begin 6–12 months before GDP growth resumes — meaning investors who wait for economic confirmation of recovery miss a significant portion of the rebound.
What assets are recession proof?
No asset is completely recession-proof, but several tend to hold value better than broad equities: U.S. Treasury bonds (flight-to-quality demand), consumer staples (non-discretionary spending stability), healthcare (inelastic demand), utilities (regulated essential services), and gold (traditional safe-haven). High-yield bonds are not recession-proof — they correlate with equities during credit stress and should not be used as a defensive vehicle.

Related Articles
[pt_view id=”9b64b383ox”]