#1 Public Site at Stockcharts.com.
The Green Line System can help you make more Money in the Stock Market!
We Buy the Strongest Stocks & ETFs on the Dips. Then they will normally go back up to retest the recent Highs.
Are You Able to Keep Up With the Flow of Money Into & Out of Markets? Technology & Filtering can give you the EDGE to win!
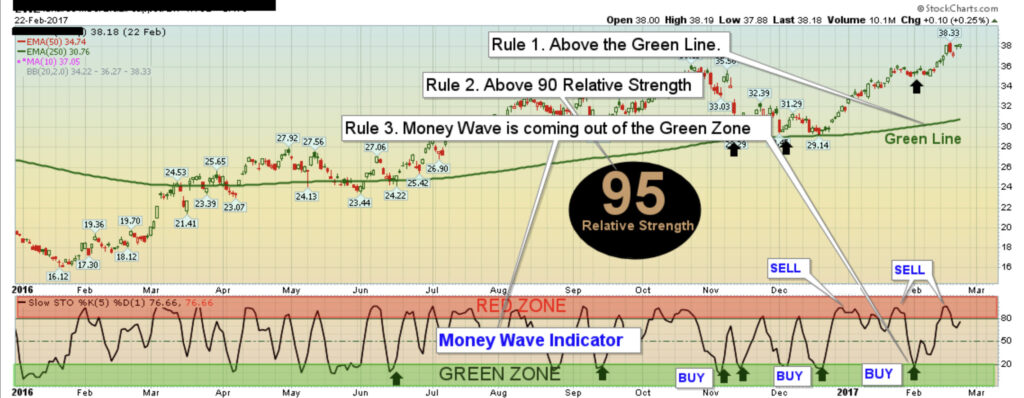
We Only follow the STRONGEST Investments. How? Just Follow these 3 Rules:
1. Only Buy Investments that are Above the Green Line. (250 day avg.)
2. Only Invest Above 90 Relative Strength Factor (Top 10% of All Investments).
3. The Money Wave Indicator should be < 20 and turning up (Buy in Green Zone, Sell in Red Zone).
KEEP IT SIMPLE: Buy in Green Zone, Sell in Red Zone.
We are Master Swing Traders, and we will email, tweet, or text you when to Buy, just before the Market Closes. Buy them when they are coming up out of the Green Zone, and take profits in the Red Zone. Split your account into 5-10 positions. The daily email or Tweet will have Buy Entry Points, Target, and Sell Stop Losses for you. Then follow them on your Positions Page.
Top Pick of the Week – Buy on Monday and Sell on Friday (very popular).
Day Trading Alerts will be sent out with Discord Trading Hub, X (Twitter) and on our Live Trading Room.
Recent Completed Swing Trades
Lots of Small Swing Trade Gains Can Add Up!
Star Rating | Open Date | Symbol | Description | Purchase Price | Sell Date | Sell Price | Net Profit | Realized Gain/Loss % | id | Strategy | Position | ATGL Rule | Industry | SCTR | Size | Comments | Stop Loss | color | Chart | Update Date | Status | Last Price | Unrealized Gain/Loss % | Daily Change % | Volume | Post Type | ATGL 60 Min | # Shares | Amount Invested | Portfolio Weight | Dividend Rate | Current Yield | Current Value | Yield on Cost | Projected Annual Dividends | Total Dividends Received | Pay Back | Profit / Loss | Annualized Profit/Loss |
---|---|---|---|---|---|---|---|---|---|---|---|---|---|---|---|---|---|---|---|---|---|---|---|---|---|---|---|---|---|---|---|---|---|---|---|---|---|---|---|
2025-02-05 | PDYN | Palladyne AI | $8.57 | 2025-02-10 | $11.00 | $2.43 | 28.35% | 4492 | Short Term | Long | STOP BELOW PINK LINE | Software | 99 | Small | Feb 10 Target was Hit a $11 with a 28.3 % Gain. | 9.61 | https://stockcharts.com/sc3/ui/?s=PDYN&a=1841322130&p=D&yr=0&mn=4&dy=0&id=p81846745501 | 2025-02-14 20:44:36 | close | $9.34 | -11.22% | 5117727 | Trade | $0 | 0.00% | $0 | 0.00% | $0 | $0 | 0.00% | 0.00% | - | |||||||
2025-02-05 | LAES | SEALSQ Corp. | $3.82 | 2025-02-11 | $3.82 | $0.00 | 0.00% | 4495 | Short Term | Long | DON’T TAKE A LOSS! | Tech | 99 | Small | Feb 11 Slipped down to the Buy Price and was Stopped Out even. | 3.82 | https://stockcharts.com/sc3/ui/?s=LAES&a=1868929019&p=D&yr=0&mn=4&dy=0&id=p83871228575 | 2025-02-11 22:53:17 | close | $3.74 | -13.63% | 17161372 | Trade | $0 | 0.00% | $0 | 0.00% | $0 | $0 | 0.00% | 0.00% | - | |||||||
2025-02-03 | KULR | KULR Tech. | $2.06 | 2025-02-11 | $2.35 | $0.29 | 14.08% | 4490 | Short Term | Long | DON’T TAKE A LOSS! | Tech | 99 | Small | Feb 11 Sold at $2.35 for a 14.1 % Gain. | 2.35 | https://stockcharts.com/sc3/ui/?s=KULR&a=1853384288&p=D&yr=0&mn=4&dy=0&id=p66921407167 | 2025-02-11 22:51:11 | close | $2.37 | -8.85% | 18255442 | Trade | $0 | 0.00% | $0 | 0.00% | $0 | $0 | 0.00% | 0.00% | - | |||||||
2025-01-31 | RKLB | Rocket Lab USA | $29.05 | 2025-02-18 | $29.05 | $0.00 | 0.00% | 4491 | Short Term | Long | DON’T TAKE A LOSS! | Tech | 99 | Small | Feb 11 Slipped down to the Buy Price and was Stopped Out even. | 29.05 | https://stockcharts.com/sc3/ui/?s=RKLB&a=1789338241&p=D&yr=0&mn=4&dy=0&id=p37633807798 | 2025-02-11 22:21:21 | close | $28.22 | -7.78% | 20748947 | Trade | $0 | 0.00% | $0 | 0.00% | $0 | $0 | 0.00% | 0.00% | - | |||||||
2025-01-30 | GEVO | Gevo Inc. | $1.77 | 2025-02-10 | $1.77 | $0.00 | 0.00% | 4483 | Short Term | Long | DON’T TAKE A LOSS! | Chemicals | 98 | Small | Feb 10 Slipped down to the Buy Price and was Stopped Out even. | 1.77 | https://stockcharts.com/h-sc/ui?s=GEVO&p=D&yr=0&mn=4&dy=0&id=p57979129269&a=1808582059 | 2025-02-10 22:58:06 | close | $1.77 | -5.35% | 7642878 | Trade | $0 | 0.00% | $0 | 0.00% | $0 | $0 | 0.00% | 0.00% | - | |||||||
2025-01-28 | UAL | United Airlines | $106.36 | 2025-01-31 | $106.36 | $0.00 | 0.00% | 4484 | Short Term | Long | DON’T TAKE A LOSS! | Transport | 93 | Large | Jan 31 Slipped down to the Buy Price and was Stopped Out even. | 106.36 | https://stockcharts.com/h-sc/ui?s=UAL&p=D&yr=0&mn=4&dy=0&id=p31903977508&a=1329670374 | 2025-02-02 21:06:49 | close | $105.84 | -3.25% | 6517008 | Trade | $0 | 0.00% | $0 | 0.00% | $0 | $0 | 0.00% | 0.00% | - | |||||||
2025-01-24 | RCAT | Red Cat Holdings | $8.63 | 2025-02-03 | $8.63 | $0.00 | 0.00% | 4482 | Short Term | Long | DON’T TAKE A LOSS! | 98 | Small | Feb 3 Slipped down to the Buy Price and was Stopped Out even. | 8.63 | https://stockcharts.com/h-sc/ui?s=RCAT&p=D&yr=0&mn=4&dy=0&id=p93712094001&a=1843123547 | 2025-02-04 00:31:26 | close | $8.82 | 0.34% | 8825951 | Trade | $0 | 0.00% | $0 | 0.00% | $0 | $0 | 0.00% | 0.00% | - | ||||||||
2025-01-23 | FUBO | fuboTV Inc. | $3.99 | 2025-02-07 | $3.99 | $0.00 | 0.00% | 4478 | Short Term | Long | DON’T TAKE A LOSS! | Communication | 98 | Small | Feb 7 Slipped down to the Buy Price and was Stopped Out even. | 3.99 | https://stockcharts.com/h-sc/ui?s=FUBO&p=D&yr=0&mn=4&dy=0&id=p74233844410&a=1874599024 | 2025-02-08 15:44:28 | close | $3.95 | -2.23% | 17168563 | Trade | $0 | 0.00% | $0 | 0.00% | $0 | $0 | 0.00% | 0.00% | - | |||||||
2025-01-23 | TBT | Inverse T-Bond 2 X Fund | $37.32 | 2025-02-04 | $35.84 | -$1.48 | -3.97% | 4479 | Short Term | Long | STOP BELOW SWING LOW | Index | 91 | ETF | Feb 4 Stopped Out on the Close. | 36.00 | https://stockcharts.com/h-sc/ui?s=TBT&p=D&yr=0&mn=4&dy=0&id=p07881133871&a=1218702110 | 2025-02-04 23:37:07 | close | $35.84 | -0.44% | 637292 | Trade | $0 | 0.00% | $0 | 0.00% | $0 | $0 | 0.00% | 0.00% | - | |||||||
2025-01-22 | CRNC | Cerence Inc. | $14.51 | 2025-02-11 | $16.00 | $1.49 | 10.27% | 4477 | Short Term | Long | DON’T TAKE A LOSS! | Tech | 99 | Small | Feb 11 Sold at $16 for a 10.3 % Gain. | 16.00 | https://stockcharts.com/h-sc/ui?s=CRNC&p=D&yr=0&mn=4&dy=0&id=p43741054814&a=1871746323 | 2025-02-11 22:49:19 | close | $14.65 | -11.21% | 3808690 | Trade | $0 | 0.00% | $0 | 0.00% | $0 | $0 | 0.00% | 0.00% | - |
Help me make more Money in the Stock Market

Please send some profits to help animals (ASPCA).

Disclaimer: The information provided herein is not to be construed as an offer to buy or sell Investments of any kind. The Investment selections on this website are not to be considered a recommendation to buy or sell any Investment but as is a mere form of expression of the writer. All information offered by Above the Green Line is for educational purposes only. Readers are urged to check with their own investment counselor before making any investment decisions.