Frequently Answered Questions.
For your convenience, most Subscriber questions are answered right here. Not finding what you want? Please use our Contact Us page.
Q: What does the Premium Service offer that the free site on StockCharts site doesn’t?
A: The content on the free StockCharts site will eventually be reduced and/or eliminated. The Premium site is for busy investors that want a Daily Commentary, Alerts, and a much larger list of Money Wave Pops emailed or Tweeted to daily. There is an Investment Forum for Q & A and Trading Room with other members. Investment selections are linked to the Chart for easy access. Our Watch List, Current Positions and Closed Positions pages are very popular, to help you keep organized.
Q: How much to become a member for your service?
A: Our subscription is $45 per monthly or $400 for the annual rate.
Q: What if I want to cancel my Subscription?
A: You can easily control and cancel or pause your Subscription online on the Main Menu under My Account.
Q: How do I change my personal settings?
A:You can make changes to your personal settings at the My Account link, on the main Menu under the “Log Out” tab.
Q: My user id / password does not appear to work – how can I fix? If it still does not work send us a note. [email protected]
A:Try logging into the website using the following URL https://abovethegreenline.com/members-page/
Q: Do you send out real time alerts?
A: Yes. For subscribers wanting fast, actionable notification – all of our posts are emailed and/or relayed through Discord & X (Twitter) (usually within 20 minutes before the Market Close). We also tweet and post Trade Alerts when specific signal have been met. Please set up a free Discord or X (Twitter) account with mobile notifications for the Fastest smart phone results. We can also send Trade Alerts via email although not as timely as tweets. In order to receive the Trade Alerts via email, please send an email to [email protected].

Q: How to use Above the Green Line?
A: Please become familiar with the DASHBOARD. Most of the links that you will need are there. Follow the Watch List Charts during the day if you have time.
Then wait for your Daily Email to arrive 10-20 minutes before the Close, and Buy or Sell as instructed. How to use Above the Green Line emails video.
The Investments we follow must meet our 3 Rules. Emails will include links to Our “Real Time” Daily & 60 min Charts which show the Red / Green Zones to help you with timing.
Q: What are the most common and favorite links of your members?
A: The most common links used by our members are compiled and listed on our DASHBOARD page.
Q: How often do you update?
A: Our charts are constantly updated and are “real time” (just refresh your browser). We will update the Chart comments at least daily or more based on the activity and/or movements in the security. Thus, you will always know if you are Above the Green Line.
Q: What is the Money Wave?
A: The Money Wave is a simple name for Slow Stochastic 5,1 on the Daily Chart.

Q: What is the Green Zone?
A: The Green Zone is the Over-Sold level Below 20 on the Money Wave (or Slow Stochastic). Buying in the Green Zone has a higher probability of success than Buying in the Red Zone (Above 80 on Money Wave).
The Money Wave (Slow Stochastic) must Close in the Green Zone (Below 20) to be a candidate for a Short Term Money Wave Buy Signal.
The Money Wave Closing > 20 creates a Short Term Buy Signal.
Q: When I get an email Buy Alert, what price do I buy at?
A: When a Money Wave Buy Signal will occur (Money Wave in going to Close > 20) , we will email you an Alert 10-20 minutes before the Market Closes. Buy anytime before, or on the Close. For logging of trades prices, we use the Closing Price on the day the Money Wave Closes > 20.
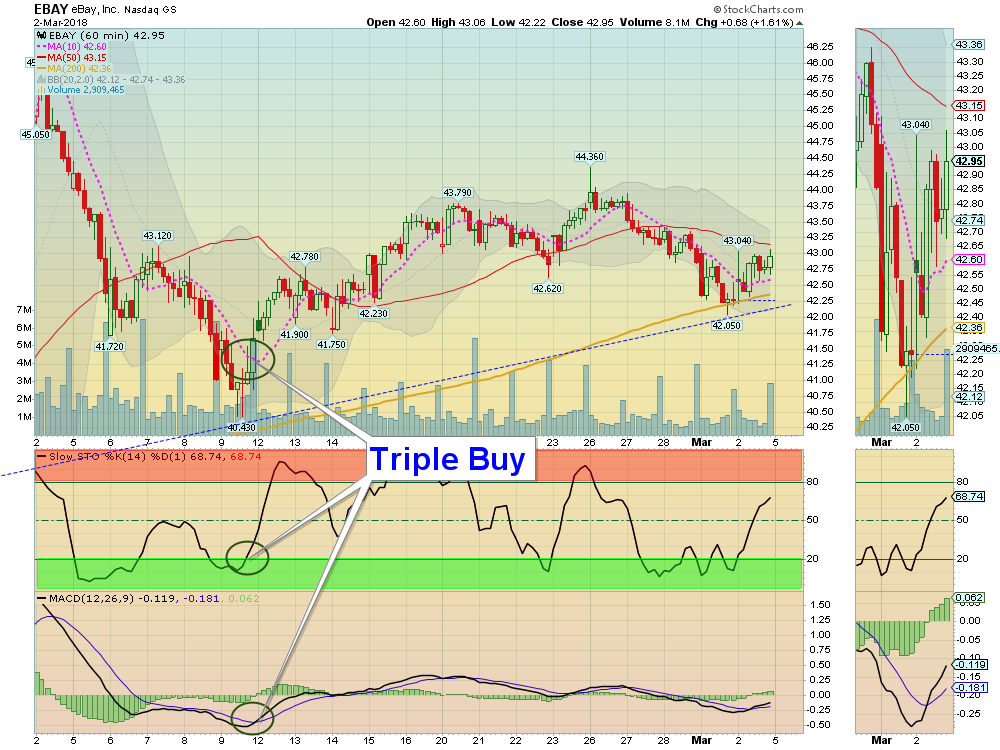
To shop for a better price during the day, many will go to the 60-min chart, and Buy in advance of the Close, but only if the Daily Money Wave is going to Close >20. Wait for the 60-min Chart to at least cross above the Pink Line, and preferably a Triple Buy on 60-min (1. Above Pink Line 2. Above 20 on Money Wave 3. MCAD Buy). The 60-min Charts are on the Watch List and click on the Green Circles.

Q: Where do I find the Relative Strength Factor in StockCharts.com so I can add it to my charts?
A: Relative Strength Values come from the SCTR Rank (StockCharts Technical Rank) for stocks, but SCTR Rank is weighted too fast (the last 90 days have priority). So we prefer www.etfscreen.com for ETFs , and Investor’s Business Daily (IBD) for stocks, but SCTR Rank is very convenient since it is on the lower left of most daily charts. We sometimes use a 155-day avg. of StockCharts SCTR, which is at the bottom left of many charts (just below the SCTR Rank) to simulate R S closer to the longer-term ranking of 1 year IBD ranking.
Q: When you say “you will Not Log the Trade” what does that mean?
A: If the Reward / Risk is not 2:1 or better we will not log the trade (or count it in our Performance Record). Some members want to see every mechanical Money Wave Buy Signal, but the Money Wave pops are usually only good for 3-6 % in the Short Term. If a stock is already up >3%, we will normally Not Log the trade.
If you Buy an Investment at $12, for a re-test of Highs at $14, the Reward potential could be $2, or 16.7%. If you have a Stop at $11.5, you are risking $0.50.
So Reward / Risk is $2 / $0.50 = 4:1 odds… EXCELLENT!
Q: What makes ups your Watch List and how often do you update?
A: Our Watch List is our list of securities currently satisfying the Above The Green Line Rules. The list is updated daily if there are new Candidates to add.
Q: Please define the Time Frames of the 3 Trading Zones.
A: Short Term: 1-3 weeks Medium Term: 3 weeks to 3 months Long Term: 3 months – 3 years.
Q: Where can I find past results?
A: The Closed Positions link is on the main Menu, under the “Portfolio” tab.
Q: Can I sort or export data shown on the Closed Positions page?
A: Yes, you can. Just click on any column header and the data will be sorted accordingly. By default, data is sorted based on the first column.
Q: Which page do you post for a day trader?
A: Day trades are stored here: Discord recent day trades. Also try the new Day Trading Watch List and on the DASH BOARD.
Q: Tell me about the Investments on the Portfolio?
A: On a periodic basis (e.g. Intraday, daily, or weekly) if a security satisfies our rules we will send out an email or Tweet notifying our members of a mechanical Buy or Sell Signals. These securities are listed on the “Current Positions” page.
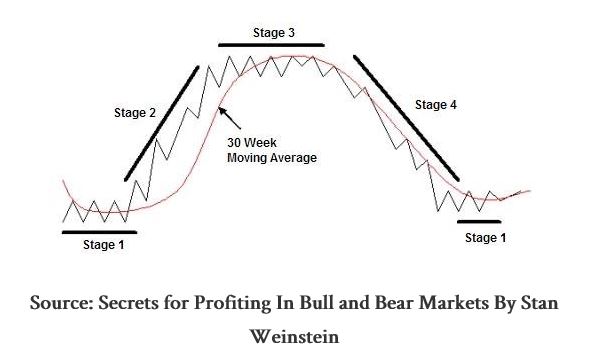
Q: What is Stage Chart Investing, and do you follow it?
A: Yes we follow Stage Chart Investing… Please click on the Link to learn about it.

Q: Mark G. writes “I’ve been following your trades for couple of months now and so far love the system. Some of your recent analysis had Reward/Risk criteria and I wonder if you have definition of poor Reward/Risk documented somewhere on the site.”
A: Thank you for writing, Mark. Reward / Risk should be at least 2:1 on every trade. If you Buy an Investment at $12, for a re-test of Highs at $14, the Reward potential could be $2, or 16.7%. If you have a Stop at $11.5, you are risking $0.50. So Reward / Risk is $2 / $0.50 = 4:1 odds… EXCELLENT!
Q: I am wondering how you find stocks for the site? What are your requirements for finding such stocks?
A: We use the Advanced Scan on StockCharts.com… We scan for average Volume > 1000000, and Relative Strength > 90.
Q: How do I get Charts on stocks I already own?
A: The chart widget shown on the Chart page provides quotes for any stock, ETF, etc. Enter the Symbol of the Investment that you want, to see the real time data. The widget allows you to add technical indicators, change the time interval, compare with other stocks, indices and even save/print the chart or tweet. In addition to the real time chart widget provided by TradingView.com, you can also view daily and weekly charts from StockCharts.
Q: How do I chat with other members?
A: Please visit the live steaming on YouTube and find the live chat on the right. MORNING MOVERS – LIVE YOUTUBE CHAT
MORNING MOVERS – LIVE STREAMING
Follow the Rules: Above the Green Line + Above 90 Relative Strength

