
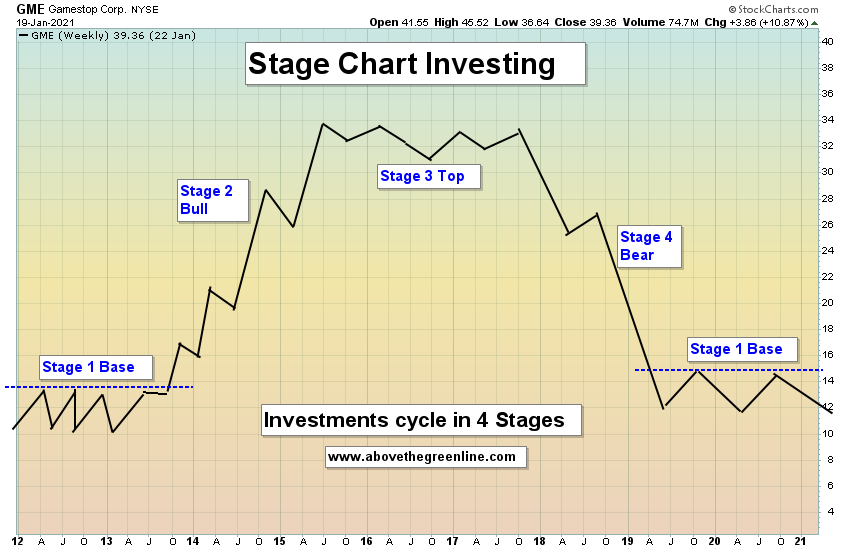
Stage Chart Investing is a simple strategy to determine the 4 Stages of an investment, and only be invested (Long or Bullish) in the Stage 2 Bull (upward tilt). Stage 2 is where your money is made.
Stage 1 is the sideways Base (indecision), Stage 3 is a Topping pattern, and Stage 4 is downward tilt (Short or Bear). Businesses evolve through 4 distinct stages, from inception to maturity. This methodology helps to not waste time in the 3 Stages that are not in upward tilt (Bull). Above the Green Line follows the Stage Chart Analysis of Stan Weinstein and recommends that all should read his book (At least Chapter 2) Secrets For Profiting in Bull and Bear Markets for timeless Technical Analysis (digital copy only $1.99 at Amazon).
Key notes from Stan Weinstein book “Secrets for Profiting in Bull and Bear Markets”
Rules
- Own Investments in Stage 2 Bull
- Short Investments in Stage 4 Bear
- Avoid Stage 1 Base (indecision) & Stage 3 Top
Stage 2 Break Out Requirements
- Break out makes a 52 week High with High Volume
- Above the Green Line
- 50 Day Avg. is Above the 250 Day Avg.
Most Stocks are currently very high historically, and are well into Stage 2 (See Charts below) of a 15 year Bull in Stocks. Bonds have now been on Stage 4 Bear since 2020 high, after a 40 year unbelievable BULL). Commodities, Interest Rates and Inverse Funds are in Stage 1 Base and could Double or Triple in the next BULL, based on History.
Shown below in the table are links to stocks in the various stages of the Stage Chart Investing strategy that are currently on ATGL watchlist. The charts are real-time, refresh the page during market hours to get an up today chart.
The 4 Stages of Stage Chart Investing.Below are two companies highlighting ALL four stages of the Stage Chart Investing life cycle.

The 4 Stages of Novavax Inc.

The 4 Stages of Riot Platforms.
