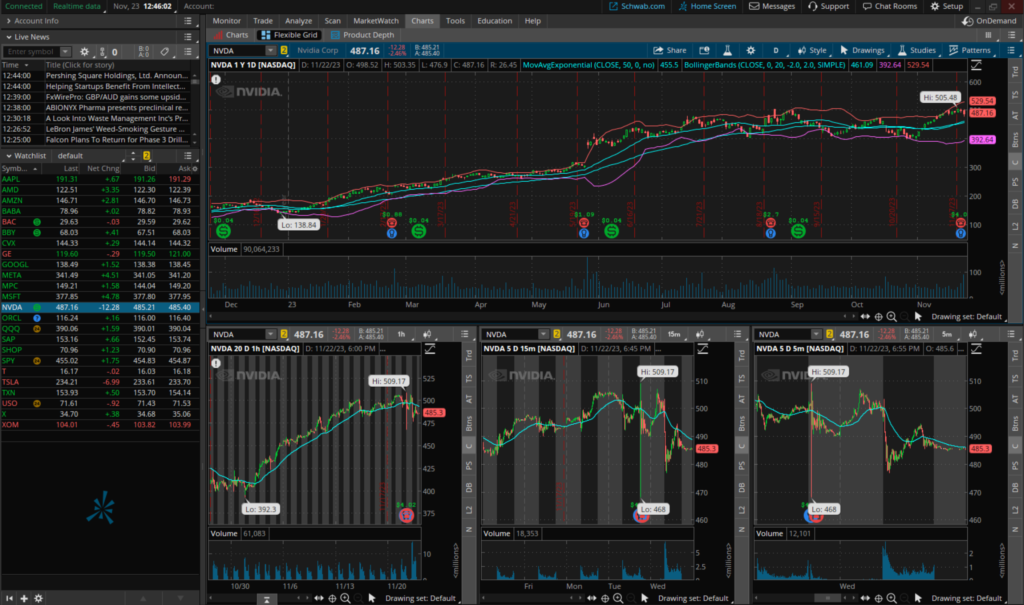
Charting Software
Stock charts are a crucial tool in investing as they provide a visual representation of a stock’s price movements over time, helping investors identify trends, patterns, and potential buy or sell signals. By analyzing these charts, investors can make informed decisions based on historical performance and market behavior, rather than relying solely on news or speculation. Stock charts also enable investors to assess the strength of a stock, understand support and resistance levels, and determine optimal entry and exit points. Ultimately, using stock charts helps investors manage risk, spot opportunities, and develop more effective investment strategies. Using advanced charting software further enhances this process by providing real-time data, customizable indicators, and advanced analysis tools, allowing investors to make more precise and timely decisions in a fast-paced market environment.
Charting software for day trading is a type of software that provides graphical representations of financial data, such as price movements, volume, indicators, and patterns, for traders to analyze and make decisions. Charting software can be used to identify trends, support and resistance levels, entry and exit points, and trading signals. Charting software can also help traders to backtest their strategies, optimize their parameters, and automate their trades. Charting software can be web-based or desktop-based, free or paid, and offer different levels of customization and functionality. Some examples of popular charting software for day trading include:
