By ATGL
Updated June 4, 2025
Chart patterns are the foundation of technical analysis, providing traders with visual frameworks to anticipate market movements and capitalize on price action. Among various bullish reversal patterns, the broadening bottom chart pattern is a powerful yet frequently misunderstood signal that can indicate significant bullish reversals. Understanding how to recognize these patterns, interpret their implications, and execute trades effectively can transform your approach to market analysis.
This guide explores recognizing and interpreting these patterns and offers effective trading strategies to capitalize on bullish opportunities.
What Is a Broadening Bottom Chart Pattern?
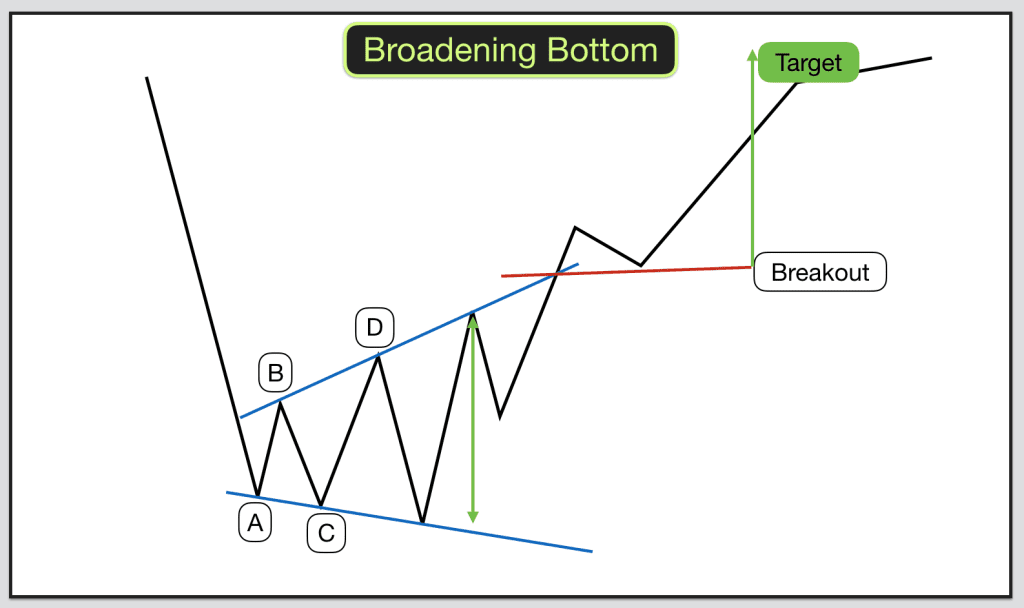
A broadening bottom chart pattern is a reversal formation marked by expanding price ranges and increased volatility as an asset approaches a turning point. It occurs when successive swing lows decline while swing highs rise, forming a widening triangle or megaphone shape. This pattern typically develops over several weeks or months, requiring at least two declining lows and two rising highs. Volume often increases during this period, signaling heightened trader interest. Unlike symmetrical triangles that contract, broadening bottom patterns expand outward, leading to wider price swings.
Broadening Bottom vs. Broadening Top
The broadening bottom formation differs fundamentally from its counterpart, the broadening top pattern, in both structure and market implications. While broadening bottoms develop during declining markets and signal potential upward reversals, broadening tops form during advancing markets and often indicate impending downward corrections.
Broadening tops typically appear after extended uptrends, reflecting distribution phases where institutional investors begin reducing positions while retail traders continue buying. Conversely, broadening bottoms emerge after prolonged downtrends, representing accumulation phases where smart money begins establishing positions while panicked sellers continue dumping shares.
Common Market Conditions for Broadening Bottoms
Broadening bottom patterns are inherently bullish reversal formations that develop during oversold market conditions. These patterns typically emerge after significant declines, major market corrections, or prolonged bear market phases when investor sentiment reaches extreme pessimistic levels.
The formations often coincide with fundamental market developments such as economic uncertainty, geopolitical tensions, or sector-specific challenges that create widespread selling pressure. Understanding the broader context of bull vs. bear market dynamics helps traders position themselves appropriately when these volatile patterns develop.
How To Identify a Broadening Bottom Pattern on Charts
Identifying broadening bottom chart patterns requires systematic observation of specific structural elements and price action characteristics. The pattern begins with at least two declining swing lows, each lower than the previous bottom, connected by a downward-sloping trendline. Simultaneously, the formation requires at least two rising swing highs, each higher than the previous peak, connected by an upward-sloping trendline.
Volume analysis plays a crucial role in pattern identification. Authentic broadening bottom patterns typically display increasing volume during formation development, with particularly strong volume spikes occurring at swing lows and highs. Time frame considerations are essential for proper identification, with patterns developing over longer periods (daily or weekly charts) tending to be more reliable than shorter-term formations.
Indicators To Use with Broadening Bottoms
Not all broadening bottom patterns lead to successful reversals, making supplementary technical indicators essential for validation. The Relative Strength Index (RSI) provides valuable insights into momentum conditions when the pattern forms. Authentic broadening bottom formations often show RSI creating higher lows even as price makes lower lows, indicating positive momentum divergence.
Moving Average Convergence Divergence (MACD) can reveal hidden strength within broadening bottom patterns. Look for MACD histogram patterns that show decreasing negative values or MACD lines beginning to converge during the pattern’s later stages. Volume-based indicators such as On-Balance Volume (OBV) can reveal institutional activity, with rising OBV values despite declining prices suggesting accumulation.
Tools and Timeframes for Identification
Daily charts are ideal for swing trading, as they show reliable formations while filtering out minor fluctuations. Weekly charts suit long-term trading, though patterns may take months to develop. Using trendline tools to connect swing lows and highs is essential for accurate pattern identification, such as the expanding triangle structure.
Multiple timeframe analysis strengthens identification accuracy and complements other trading patterns that traders use for comprehensive market analysis. Begin with daily charts for primary pattern identification, then examine weekly charts for broader context and hourly charts for precise entry timing.
Key Trading Strategies for Broadening Bottom Patterns
Effective trading strategies for broadening bottom chart patterns require patience, discipline, and a systematic approach to entries and exits. The conservative strategy is to wait for confirmed breakouts above the upper trendline, ideally with volume expansion, to reduce false signals, though this may limit potential profits.
Conservative traders should enter trades after confirming breakouts with sustainable price action above the breakout level, typically waiting one to three sessions. Position sizing must account for the pattern’s volatility, necessitating smaller sizes to manage risk. Stop-losses should be placed below the recent swing low or the lower trendline, depending on entry timing.
Common Pitfalls When Trading Broadening Bottoms
False breakouts are a major challenge in trading, broadening bottom patterns, which occur when prices briefly break above the upper trendline but then reverse. Volume analysis can help differentiate between true breakouts and false signals, as genuine breakouts usually show increased volume. Additionally, misidentifying patterns and emotional decision-making can lead to poor trading outcomes, often driven by fear and greed amid high volatility.
Inadequate risk management often amplifies losses when broadening bottom trades fail. Professional risk management requires position sizing that accounts for the pattern’s volatility characteristics and stop-loss placement that provides adequate protection. Success requires identifying trends accurately to determine whether the broader market environment supports bullish reversals or suggests continued weakness.
Visual Examples of Broadening Bottom Patterns in Action
Historical market examples illustrate how broadening bottom chart patterns develop and resolve in real trading scenarios. During the 2020 market correction, many individual stocks and sector ETFs developed broadening bottom formations as unprecedented volatility created expanding price ranges. Technology stocks, in particular, showed classic broadening bottom patterns as investors struggled to value companies amid rapidly changing business conditions.
The financial sector during the 2008-2009 financial crisis provides excellent examples of broadening bottom patterns preceding major bull market rallies. Banking stocks, such as JPMorgan Chase and Bank of America, developed textbook-broadening bottom formations during late 2008 and early 2009, with successful breakouts leading to substantial multi-year advances.
The pattern’s effectiveness varies based on market conditions and time frames. Weekly chart examples typically show more reliable signals than daily formations, though they require longer holding periods to capture full profit potential. These formations often work in conjunction with other bullish chart patterns, like the bull flag pattern, to create comprehensive reversal scenarios.
Build Your Edge with Pattern-Based Trade Signals
Mastering broadening bottom chart patterns helps traders identify market turning points and capitalize on volatility. While challenging to trade, these patterns can yield significant profits when identified and executed correctly. Success depends on developing systematic recognition skills, disciplined strategies, and strong risk management.
Enhance your pattern recognition skills and trading strategies with comprehensive trading education resources. A membership to Above the Green Line’s educational platform provides detailed instruction on advanced chart pattern analysis, risk management techniques, and systematic trading approaches to elevate your trading performance and build consistent profitability in volatile market conditions.

Related Articles
[pt_view id=”9517038dwu”]