By Andrew Stowers
Updated May 19, 2026
Most people learn what a bull market is when they’re already in one — when portfolios are growing, financial media is optimistic, and everyone seems to be winning. The investors who generate real wealth during bull markets are those who understand the structure before it starts.
The conditions that birth a bull market. The phases it moves through. How to identify where it stands in real time. And — critically — when the signs of an ending begin to appear beneath the surface of continued price gains.
This guide covers all of it: a precise definition, the two types of bull market, historical context from post-WWII data, the five drivers that sustain rising markets, a four-phase framework for knowing exactly where you stand, and a rules-based approach to trading the environment while managing the risks that peak enthusiasm conceals. For a grand overview of all things stock trading, we encourage you to review our Stock Trading Guide after reading through this post to see how it all fits together.
What Is a Bull Market? (The Precise Definition)
| Quick Answer
A bull market is a sustained period of rising prices in financial markets, most commonly defined as a rise of 20% or more in a major stock index from its most recent trough. Bull markets are driven by investor confidence, expanding corporate earnings, and favourable economic conditions — and typically last months to years. |
The 20% threshold is a convention, not a regulatory definition. No government body or exchange officially declares bull markets — the designation is made by analysts and financial media using this widely accepted benchmark. The threshold mirrors the bear market definition in reverse: a bear market is declared when prices fall 20% from a peak; a bull market is declared when prices rise 20% from a trough.
From the Trough — Not From Any Low
A detail that matters more than most introductory explanations acknowledge: bull markets are measured from the most recent confirmed trough — the lowest closing price in a given decline — not from an arbitrary starting point. This is why bull market start dates are often only confirmed retrospectively. In real time, no one can be certain a trough is complete until prices have risen meaningfully from it.
The practical implication: early bull market identification is inherently uncertain. A 15% rally from a trough might be a bear market rally — a temporary recovery within a continuing downtrend — or the beginning of a genuine bull market. The 20% threshold and sustained advance over time are what distinguish the two.
Bear Market vs Correction vs Bull Market: The Three Regimes
Three market regimes are defined by magnitude and direction:
- Market correction: a decline of 10-20% from a recent peak — a normal, recurring occurrence within bull markets; corrections do not end bull markets
- Bear market: a decline of 20%+ from a peak — a regime shift requiring meaningful deterioration in economic or earnings conditions
- Bull market: an advance of 20%+ from a trough — a sustained uptrend driven by improving fundamentals and investor confidence
Understanding which regime you are in is the foundation of any market-aware investment strategy.
Cyclical vs Secular Bull Markets: Understanding the Two Types
Not all bull markets are the same in character, duration, or what drives them. The distinction between cyclical and secular bull markets is one of the most strategically important frameworks in market analysis — and one of the most underexplained.
Cyclical Bull Markets
A cyclical bull market is a rising market environment driven by the normal rhythms of the economic cycle — recovery from recession, improving employment, rising corporate earnings, and typically accommodative monetary policy in the early stages. Cyclical bull markets last approximately 1-4 years, are eventually ended by monetary policy tightening, rising valuations, or an economic downturn, and are followed by cyclical bear markets.
Cyclical bull markets are the most commonly encountered market environment. Post-WWII U.S. economic history contains numerous cyclical bull markets — rising from recession lows, running through expansion, and ending as the cycle matures.
Secular Bull Markets
A secular bull market is a decade-long or longer sustained uptrend driven by deep structural forces — transformative technological cycles, demographic tailwinds, major monetary regime changes, or globalisation-driven productivity gains. The two most commonly cited modern secular bull markets in U.S. equities are 1982-2000 (driven by disinflation, the computing revolution, and deregulation) and 2009 to the mid-2020s (driven by unprecedented monetary accommodation and the digital economy transition).
The crucial characteristic of a secular bull market: it contains multiple cyclical bear markets within its broader uptrend. The 1987 crash, the early 1990s recession bear market, and the 1994 rate-shock correction all occurred within the 1982-2000 secular bull. The 2020 COVID crash, a decline of 34%, occurred within the broader secular bull market of the 2010s. These were cyclical interruptions, not secular reversals.
For investment strategy, the distinction matters: within a secular bull market, corrections and cyclical bear markets can be bought more aggressively, knowing the structural tailwind remains intact. Cyclical bull market investors need to monitor economic cycle maturity signals more actively.
Historical Bull Markets: What the Data Actually Shows
Historical data on U.S. bull markets — measured by the S&P 500 — provides the clearest picture of what these periods look like in duration and magnitude. The figures below are approximate historical data; precise measurements vary by methodology.
| Approximate Start | Approx. End | Duration | S&P 500 Return | Notable Driver |
|---|---|---|---|---|
| June 1949 | Aug 1956 | ~86 months | ~267% | Post-WWII economic expansion |
| Oct 1957 | Dec 1961 | ~50 months | ~86% | Space age / consumer boom |
| June 1962 | Feb 1966 | ~43 months | ~80% | Kennedy/Johnson economic growth |
| Oct 1966 | Nov 1968 | ~25 months | ~48% | Vietnam war spending, low unemployment |
| Aug 1982 | Aug 1987 | ~60 months | ~229% | Disinflation / Reagan era expansion |
| Dec 1987 | Mar 2000 | ~149 months | ~582% | Internet revolution / secular bull |
| Oct 2002 | Oct 2007 | ~60 months | ~101% | Housing / credit expansion |
| Mar 2009 | Feb 2020 | ~131 months | ~400% | Longest on record / QE era |
| Mar 2020 | Jan 2022 | ~22 months | ~114% | COVID recovery / stimulus |
| Oct 2022 | ongoing | Ongoing | TBD | AI investment cycle |
Approximate historical data. S&P 500 return figures measured trough-to-peak. Exact dates vary by analytical methodology.
What the Data Shows
- Average bull market duration: approximately 4-5 years (~50-60 months) excluding the two secular bull outliers
- Average bull market return: approximately 150-180% trough-to-peak for cyclical bulls; 400-580% for secular bulls
- Bear market comparison: average bear market lasts approximately 9-14 months — significantly shorter than the average bull market
- Time in bull markets vs bear markets: historically, U.S. markets have spent approximately 80% of the time in bull markets — time in the market matters
What Drives a Bull Market? The Five Economic and Market Conditions
Understanding what initiates and sustains bull markets is not simply academic — it is the foundation for identifying when conditions are favourable for a new bull market to begin and for assessing how much runway the current one has remaining.
1. Corporate Earnings Expansion
Expanding earnings per share (EPS) is the fundamental engine of equity bull markets. When companies grow revenues and profit margins, their intrinsic value increases — and stock prices rise to reflect it. Bull markets that are accompanied by genuine earnings growth are more durable than those driven primarily by multiple expansion (investors paying a higher price per dollar of earnings without underlying growth to justify it).
2. Interest Rate Environment
Low or declining interest rates support bull markets through two reinforcing mechanisms: they reduce the discount rate applied to future corporate earnings (making the present value of those earnings higher), and they make stocks more attractive relative to bonds and savings instruments. The 2009-2020 bull market was substantially fuelled by the Federal Reserve’s unprecedented zero-rate policy and quantitative easing programmes.
3. Economic Expansion
GDP growth, falling unemployment, and rising consumer confidence create the demand environment that drives corporate revenues. Employment is one of the most reliable leading indicators of consumer spending — when people are employed and feel secure, they spend, and corporate revenues follow. Bull markets rarely sustain for extended periods against a deteriorating employment backdrop.
4. Federal Reserve Policy
Accommodative monetary policy — low rates, asset purchases, forward guidance — provides the liquidity fuel for sustained bull markets. Conversely, tightening monetary policy (rate hikes, quantitative tightening) is one of the most reliable precursors to bull market endings. The Fed does not cause bull markets, but its policy stance creates or removes the conditions in which they flourish.
5. Investor Sentiment and Risk Appetite
Bull markets require sustained optimism — the collective willingness of buyers to pay progressively higher prices. Sentiment feeds on itself: rising prices attract more buyers, which drives prices higher, which attracts more buyers. This self-reinforcing dynamic is what allows bull markets to persist well beyond what fundamentals alone would justify — and it is also what makes late-stage bull markets so dangerous for investors who extrapolate recent performance into the future.
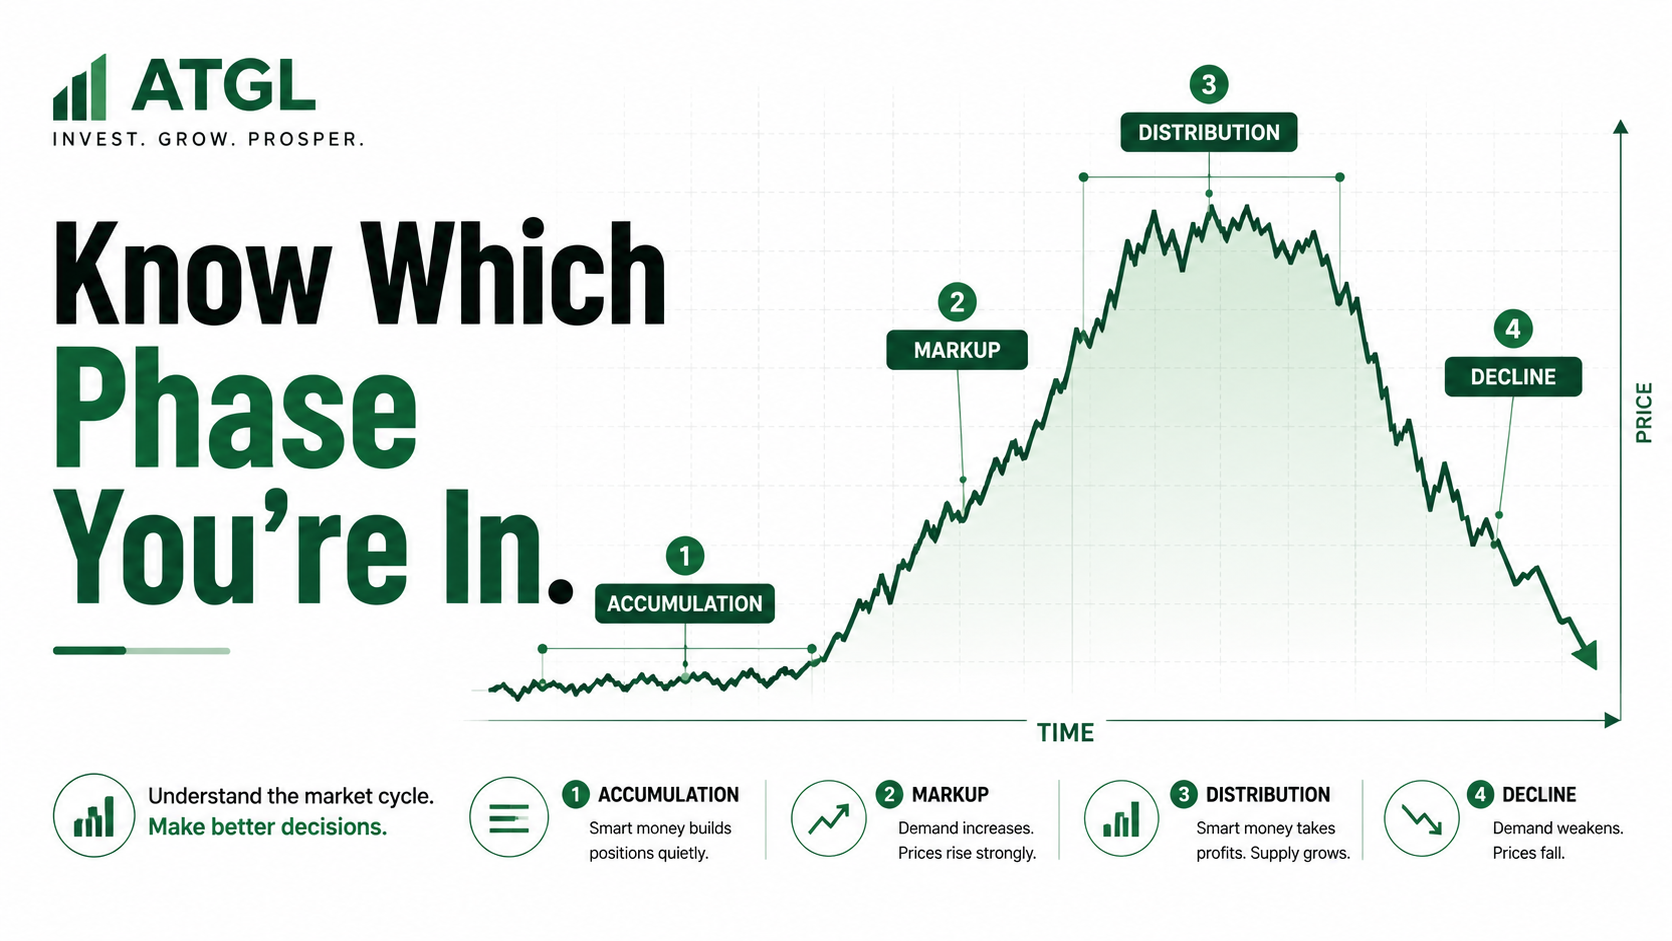
The Four Phases of a Bull Market — and How to Identify Each One
| ATGL’s Phase Framework
A bull market is not a uniform, undifferentiated rise. It moves through four distinct phases — each with different characteristics, different dominant investor behaviors, and different strategic implications for active traders. Knowing which phase the market is in is more actionable than simply knowing whether you are in a bull or bear market. |
Phase 1: Accumulation
Accumulation occurs while sentiment is still deeply negative from the prior bear market. Economic news is bad, financial media is pessimistic, and most retail investors are unwilling to buy. Into this environment, informed investors — institutions, value investors, and experienced traders — begin quietly building positions in undervalued assets.
Prices are depressed. Volume is low. There is no confirmation that a new bull market has begun — and in fact, it often hasn’t been confirmed by the 20% threshold yet. The Accumulation phase is the hardest to identify in real time, and the most profitable in retrospect. The investors who participate in Accumulation capture the most return per unit of risk of any bull market phase.
Phase 2: Markup (Early Bull Market)
The bull market becomes visible during the Markup phase. Prices begin rising consistently and with conviction. Volume increases as more investors participate. Economic data starts improving — earnings beats emerge, employment stabilizes, confidence surveys turn positive. Moving averages begin trending upward and provide rising support levels on pullbacks.
Media coverage turns cautiously optimistic. The phrase ‘green shoots’ appears in financial reporting. At this stage, the 20% threshold has been crossed and the bull market is formally declared — often well into the Markup phase, meaning many investors only feel comfortable buying after much of the early-phase gains have already occurred.
Phase 3: Distribution (Late Bull Market)
Distribution is the most dangerous phase for investors who are not watching carefully. Prices continue rising — sometimes to new all-time highs — but beneath the surface, the character of the advance changes fundamentally. Breadth narrows: fewer individual stocks are making new highs even as the index advances, because the gains are concentrated in a shrinking number of large-cap leaders. Institutional investors begin selling into retail enthusiasm.
Public sentiment reaches its most bullish at precisely this point — magazine covers celebrate the bull market, casual investors discuss stocks at dinner parties, and FOMO (fear of missing out) draws in the last wave of buyers. Meanwhile, the smart money is distributing: selling their positions into the demand that public enthusiasm creates. Valuations are stretched. Warning signs are present but being rationalised away.
Phase 4: Decline (New Bear Market Begins)
The Distribution phase ends when selling pressure overwhelms buying demand. What was dismissed as healthy correction during late Distribution is confirmed as the beginning of a new bear market. Fundamentals deteriorate — earnings disappoint, economic data weakens, credit conditions tighten. The cycle completes and Accumulation begins again at the new lows.
How to Trade a Bull Market: The ATGL Rules-Based Approach
Understanding bull market phases is only valuable if it translates into specific, actionable trading behaviour. The following framework reflects ATGL’s rules-based approach to maximising returns in trending markets while maintaining the discipline that protects capital as conditions change.
1. Confirm the Trend with Moving Averages
The 200-day moving average is the most widely watched long-term trend indicator in equity markets. When the S&P 500 is trading above a rising 200-day moving average — and the 50-day moving average is above the 200-day (a configuration called the golden cross) — objective trend confirmation is in place. This is the clearest technical signal that a bull market’s Markup phase is underway.
Trading on the right side of these averages — buying dips to rising moving average support rather than fighting the trend — is the most consistently effective approach to capturing bull market returns with manageable risk.
2. Buy Pullbacks, Not Peaks
The most consistent bull market entry strategy is buying pullbacks to rising support levels — prior resistance that has become support, rising moving averages, key retracement levels — rather than chasing momentum at new all-time highs after extended runs. Buying into strength after a prolonged advance is the strategy that maximizes the probability of entering at a poor risk/reward ratio.
3. Size Positions for the Trend Environment
Trending bull market environments allow for more aggressive position sizing than range-bound or volatile markets — the probability of trend continuation is higher, and the expected value of long positions is positive. However, discipline requires that position sizing never exceed defined risk parameters regardless of conviction level. Late-stage bull markets are precisely when concentration risk — over-sizing positions in recent high-momentum winners — is most dangerous.
4. Manage the FOMO Trap
The most predictable psychological failure in bull markets is FOMO — the fear of missing out that draws investors into markets at the worst possible entry points. Investors who under-participated in the early phases of a bull market experience increasing urgency as the market rises, eventually capitulating and buying aggressively during the Distribution phase — exactly when institutions are selling.
Rules-based investing eliminates FOMO by replacing emotional urgency with systematic criteria. When the entry criteria are not met, capital stays in cash or low-risk instruments. When criteria are met, the position is taken at the defined size. The process eliminates the ad hoc decision-making that FOMO exploits.
5. Tighten Risk Management as Warning Signs Appear
As late-stage warning signs accumulate — narrowing breadth, stretched valuations, inverted yield curve, weakening leading economic indicators — the appropriate response is not to exit all positions but to tighten risk parameters. Reduce position sizes. Raise stop levels. Require higher conviction thresholds for new entries. Let the market confirm deterioration before aggressively repositioning defensively.
Late-Stage Warning Signs: When the Bull Market May Be Ending
No single indicator reliably predicts bull market endings in advance. But a cluster of warning signs, accumulated over weeks or months, provides meaningful signal that the Distribution phase has arrived and the risk/reward environment has shifted.
1. Narrowing Market Breadth
When the major index continues making new highs but the advance-decline line is declining — meaning more individual stocks are falling than rising, even as the index advances — the bull market is being carried by a shrinking number of large-cap leaders. This is the classic early signature of Distribution. Breadth divergence has preceded every major bull market peak in modern history.
2. Inverted Yield Curve
When short-term Treasury yields exceed long-term yields — the yield curve inverts — it signals that credit markets are pricing in economic deterioration ahead. The inverted yield curve has preceded every major U.S. recession and bear market in the post-WWII era. ATGL covers the mechanics and history of this indicator in dedicated content.
3. Stretched Valuations
High P/E ratios relative to historical averages do not cause bear markets on their own — overvalued markets can remain overvalued for extended periods. But stretched valuations remove the margin of safety that absorbs negative surprises. When a market at 30x earnings receives an earnings disappointment, the correction is much more severe than if the same disappointment occurs at 15x earnings.
4. Peak Sentiment and Media Euphoria
When mainstream financial media turns uniformly bullish, when cover stories declare the end of bear markets, when conversation about stocks becomes ubiquitous in non-financial social contexts — these anecdotal signals of peak sentiment historically coincide with late-stage Distribution. The contrarian insight: maximum public enthusiasm marks the point of maximum institutional selling.
5. Deteriorating Leading Economic Indicators
The economic data that precedes fundamental deterioration: ISM manufacturing PMI falling below 50, initial jobless claims beginning to rise from cycle lows, consumer confidence surveys reversing, leading indicators published by the Conference Board turning negative. These signals precede the earnings deterioration that eventually ends bull markets — monitoring them provides early warning before the bear market is confirmed by the 20% threshold.
Know the Structure Before the Next One Starts
Bull markets are the environment in which most investment wealth is created. They are also the environment in which the most costly investing mistakes are made — by those who identify them late, chase them at peaks, and abandon them at corrections out of fear.
The framework in brief:
- A bull market is a 20% rise from a trough — measured from the lowest closing price, typically confirmed only in retrospect
- Cyclical bull markets last 1-4 years; secular bull markets last decades and contain cyclical bear markets within them
- Five drivers: earnings growth, low rates, economic expansion, Fed policy, investor confidence — monitor all five for sustainability assessment
- Four phases: Accumulation (buy quietly), Markup (trend confirmation, increase exposure), Distribution (tighten risk, watch breadth), Decline (new bear market begins)
- Rules-based trading: confirm with moving averages, buy pullbacks not peaks, size for the environment, eliminate FOMO with systematic criteria, tighten stops as warning signs accumulate
- Late-stage signals: breadth divergence, inverted yield curve, stretched valuations, peak sentiment, deteriorating leading indicators — no single indicator is definitive; watch the cluster
The investor who understands these structures does not need to predict bull markets. They need to recognise them, respond systematically to each phase, and manage risk as conditions change. The framework above is the foundation. The system makes it repeatable.
| Trade Every Market Cycle With a Complete System
At AboveTheGreenLine.com we give investors and active traders the rules-based framework for navigating every market environment — bull markets, bear markets, and the transitions between them. If you want the complete system, join us Above the Green Line. |
Frequently Asked Questions
How long does a bull market last?
Post-WWII U.S. bull markets have lasted an average of approximately 4-5 years (roughly 50-60 months) for cyclical bulls, with the longest on record — the 2009-2020 bull market — lasting approximately 131 months. Bull markets are almost always longer than bear markets: the average bear market has lasted approximately 9-14 months. However, duration varies considerably with economic conditions, and individual investors should focus on monitoring current conditions rather than assuming a historical average applies.
What percentage is considered a bull market?
A bull market is conventionally defined as a rise of 20% or more in a major stock index — typically the S&P 500 in the U.S. — from its most recent trough (lowest closing price). This 20% threshold mirrors the bear market definition in reverse and is the most widely used market convention. It is not a regulatory definition — no official body declares bull markets — but it is the standard that financial analysis and media use to identify market regime transitions.
What happens to stocks in a bull market?
During bull markets, stock prices rise broadly as investor confidence increases, corporate earnings expand, and economic conditions improve. Early bull market phases tend to be led by beaten-down value stocks recovering from bear market lows. Later phases are often led by growth and momentum names. Broad participation — most stocks in the index rising together — is a healthy bull market characteristic. Narrow participation, where only a handful of mega-cap stocks drive index gains while the broader market stagnates, is a late-stage warning signal.
What causes a bull market to end?
Bull markets typically end when one or more of their sustaining drivers deteriorates: monetary policy tightening (the Federal Reserve raising rates aggressively), a significant economic slowdown or recession, a sharp decline in corporate earnings, or an exogenous shock (financial crisis, pandemic, geopolitical event). Historically, monetary tightening in response to inflationary pressure has been the most common bull market ending mechanism. The late-stage warning signs — inverted yield curve, narrowing breadth, deteriorating leading indicators — often precede the final peak by months.

Related Articles
[pt_view id=”9517038dwu”]