By ATGL
Updated February 28, 2025
An inverted yield curve occurs when short-term interest rates exceed long-term rates, a rare phenomenon that has historically signaled economic downturns. Investors closely monitor yield curve inversions because they often precede recessions, affecting interest rates, stock markets, and fixed-income investments. Understanding the mechanics behind yield curve movements and their implications can help you make more informed decisions about portfolio allocation and risk management.
Understanding an Inverted Yield Curve
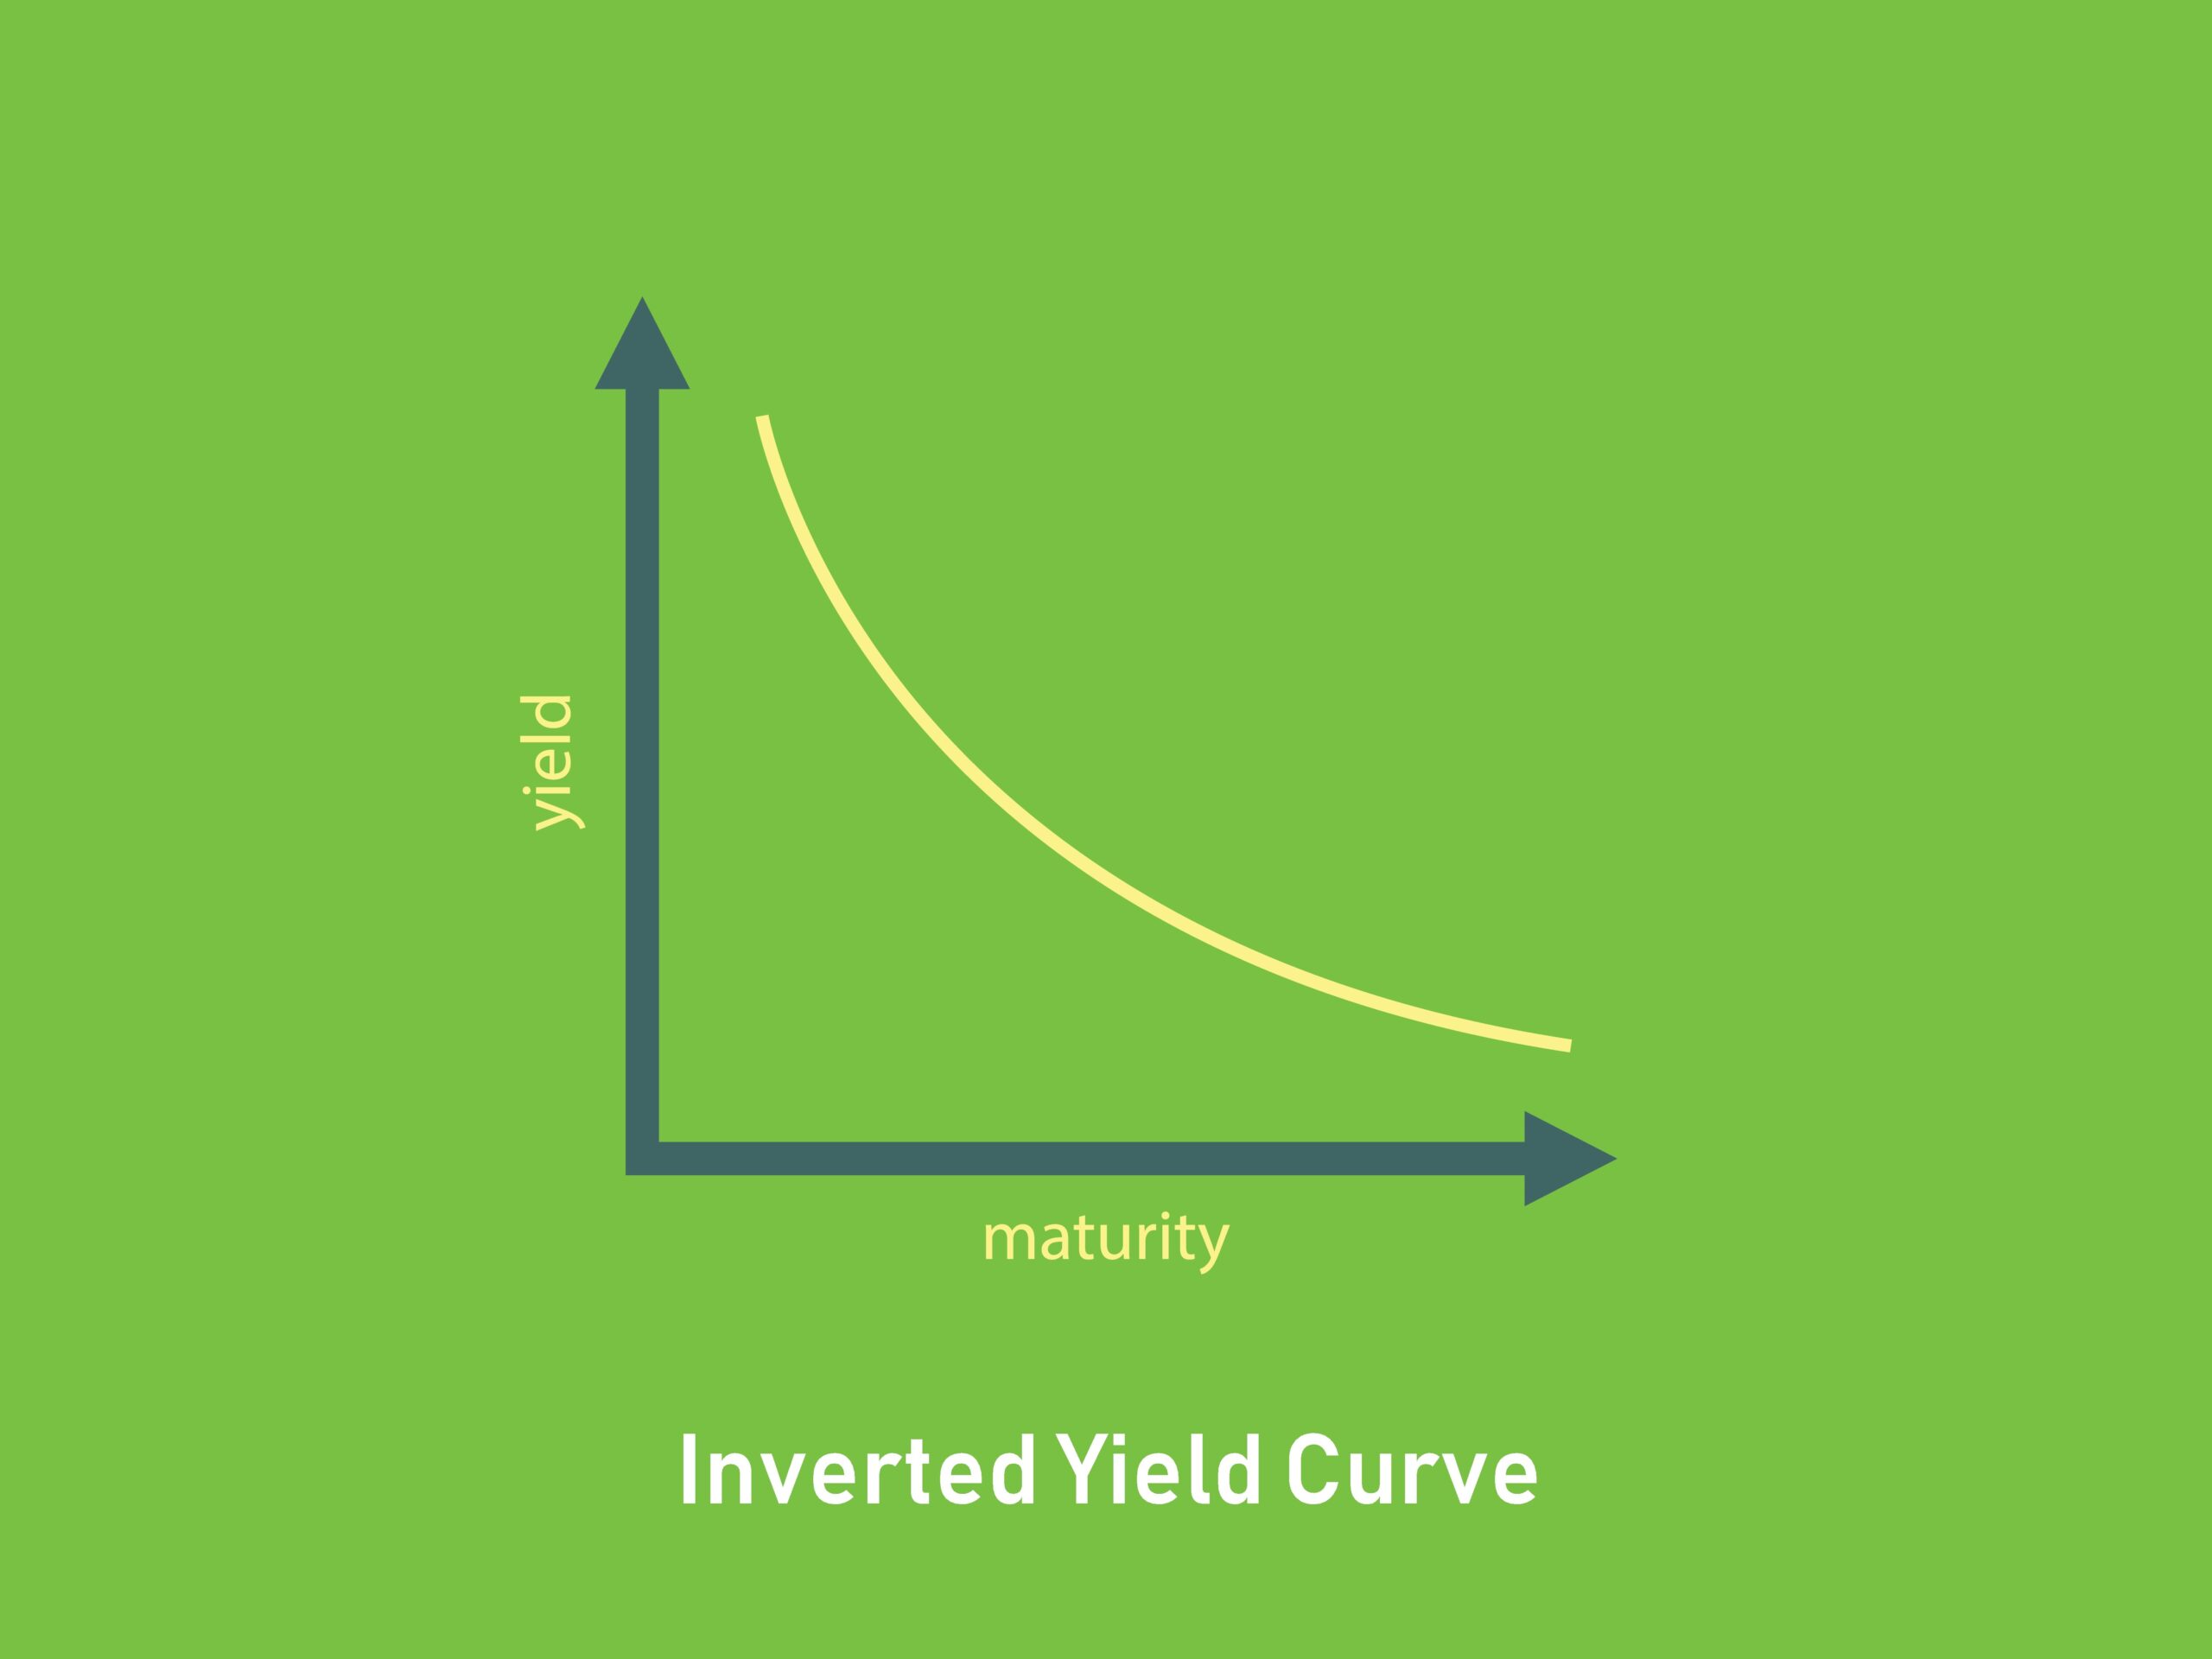
A yield curve represents the relationship between bond yields and their maturities. Under normal economic conditions, longer-term bonds offer higher yields than short-term bonds due to the added risk of holding debt over extended periods. This upward-sloping curve reflects expectations for economic growth and inflation.
When the yield curve inverts, short-term yields surpass long-term yields, suggesting that investors expect weaker economic growth and potential rate cuts by the Federal Reserve. This shift is driven by heightened demand for long-term bonds, pushing their prices up and yields down, while short-term rates remain high due to central bank policies or market conditions.
Historically, inverted yield curves have been reliable recession indicators. According to research from the Federal Reserve Bank of San Francisco, every U.S. recession since 1955 has been preceded by a yield curve inversion. On average, a downturn follows within six to 24 months.
How To Interpret an Inverted Yield Curve
An inverted yield curve reflects investor sentiment about future economic conditions. Typically, it signals expectations of slower growth, reduced inflation, or even an economic contraction.
Monetary Policy and Interest Rates
The Federal Reserve’s policies significantly influence short-term interest rates. When the Fed raises rates to combat inflation, borrowing costs increase, slowing economic activity. If the market anticipates that these rate hikes will dampen growth, investors may shift capital into long-term bonds for stability, lowering their yields.
Market Expectations and Risk Aversion
An inversion often reflects heightened investor caution. When economic uncertainty rises, institutions and individuals move funds into longer-term Treasury bonds, seeking safety rather than riskier assets like equities. This demand suppresses long-term yields relative to short-term ones.
Credit Conditions and Business Cycles
Banks use the yield curve as a benchmark for lending. When short-term rates rise above long-term rates, profit margins for lenders shrink, discouraging credit expansion. This tightening of credit can slow business investment and consumer spending, reinforcing economic slowdown risks.
How Long Has the Yield Curve Been Inverted?
Yield curve inversions vary in duration. Some last only a few months, while others persist for years. One of the most recent inversions lasted from July 2022 to August 2024. The yield curve inverted again in late February 2025.
Examining past inversions provides insight into potential outcomes. For instance, the yield curve inverted in 2000 before the dot-com crash and again in 2006–2007 before the financial crisis. However, while inversions have a strong historical track record as recession signals, they don’t indicate precise timing or severity. You should analyze other economic indicators alongside the yield curve to assess recession risks.
The Impact of an Inverted Yield Curve on Markets
An inverted yield curve affects multiple asset classes, influencing investor behavior and market trends.
Fixed-Income Investments and Bond Pricing
As demand for long-term bonds rises, their prices increase, causing yields to decline. This environment benefits investors already holding long-duration bonds because their prices appreciate. However, new bond investors face lower yields, reducing potential income.
In this scenario, yield to maturity and yield to worst calculations become important in evaluating bond investment risks and returns in an inverted curve environment. Investors can use these metrics to determine the actual return they can expect if they hold a bond until maturity or if the issuer calls it early, helping them manage risk in a market where interest rate expectations are shifting.
Equity Markets and Economic Sentiment
Stock market reactions to yield curve inversions vary. While some investors move capital away from equities toward safer assets, others use inversions as buying opportunities, particularly in defensive sectors such as consumer staples and utilities. Historically, equities often continue performing well for a period after an inversion but may experience increased volatility as recession risks grow.
Banking Sector and Credit Availability
An inverted yield curve pressures financial institutions by reducing the profitability of traditional lending. Banks typically borrow at short-term rates and lend at long-term rates, profiting from the spread. When this spread narrows or turns negative, banks tighten credit conditions, which can slow economic activity further.
Using the Yield Curve in Investment Strategies
You can use yield curve analysis to refine portfolio strategies and adjust risk exposure. During inversions, several approaches can help you navigate shifting market conditions:
- Increase Exposure to Defensive Sectors: Stocks in healthcare, utilities, and consumer staples tend to be more resilient during economic slowdowns, offering stable earnings and consistent dividends.
- Adjust Bond Duration and Quality: Short-term bonds provide higher yields with lower volatility, while high-quality long-term bonds may appreciate if interest rates decline. A balanced approach can help manage risk.
- Evaluate Callable Bonds and Yield to Call: Investors holding callable bonds should assess their yield to call rather than just yield to maturity, as issuers may redeem bonds early if interest rates fall. This is particularly relevant in an inverted yield curve environment where future rate cuts are expected.
- Hold Cash and Cash Equivalents: Treasury bills, money market funds, and other short-term instruments offer competitive returns with minimal risk, providing liquidity during uncertain periods.
- Reduce Leverage and Speculative Positions: As credit conditions tighten, high-risk investments become more vulnerable. Managing margin exposure and avoiding over-concentration in speculative assets can help preserve capital.
- Monitor Federal Reserve Policy and Market Signals: The Fed’s response to an inversion, including potential rate cuts, can significantly impact asset prices. Tracking economic indicators alongside the yield curve helps investors stay ahead of market shifts.
Monitoring the Yield Curve and Economic Indicators
Analyze yield curve inversions alongside other macroeconomic indicators. Key metrics include:
- 10-Year vs. 2-Year Treasury Yield Spread: The most widely used measure for detecting yield curve inversions.
- Federal Reserve Policy Statements: Interest rate decisions provide insights into potential monetary policy shifts.
- Economic Growth Data: GDP, employment reports, and inflation trends offer broader context for interpreting yield curve movements.
You can use government bond yield reports, financial news platforms, and analytical tools to track these indicators and make data-driven decisions.
Making More Money on the Stock Market
Navigating markets during a yield curve inversion requires strategic adjustments, but it also presents opportunities. When you understand how economic cycles impact different asset classes, you position yourself for long-term success.
For expert investment insights and systematic market analysis, explore Above the Green Line’s membership options. Our approach helps you capitalize on market trends and optimize portfolio strategies during uncertain economic conditions.

Related Articles
[pt_view id=”e2b53bb6zw”]