By ATGL
Updated February 23, 2025
Yield to maturity represents the total return anticipated on a bond if the investor holds it until its maturity date. This bond yield measurement calculates the present value of all future interest payments and the return of principal, expressed as an annual rate. For investors analyzing fixed-income securities, understanding YTM provides critical insights into bond valuations and potential returns.
What Is Yield to Maturity?
When evaluating bonds, yield to maturity offers a complete picture — more than simply looking at current yield or coupon rates. YTM accounts for three key components: the bond’s purchase price relative to its par value, periodic interest payments, and the time value of money. This metric becomes particularly valuable when comparing bonds with different characteristics or evaluating whether a bond aligns with investment objectives.
Importance of Yield to Maturity in Investing
YTM serves as a standardized measure for comparing bonds with varying maturities, coupon rates, and prices. This standardization allows you to make informed decisions when selecting fixed-income securities for your portfolio. For instance, two bonds might offer identical coupon rates, but their yields to maturity could differ significantly based on their market prices and time until maturity.
Key Concepts Related to YTM
Coupon Rate
The coupon rate reflects the fixed interest payments a bond makes relative to its face value. For example, a $1,000 bond with a 5% coupon rate pays $50 annually in interest. While coupon rates provide steady income streams, they represent only one component of a bond’s total return potential. Market conditions can cause bonds to trade above or below their face value, creating disparities between coupon rates and actual yields. Understanding this relationship helps you evaluate whether a bond’s price aligns with its income-generating potential.
Current Yield
Current yield provides a real-time snapshot of a bond’s income relative to its market price, calculated by dividing annual interest payments by the bond’s current price. This metric proves particularly valuable when comparing bonds trading at different prices. For instance, if a $1,000 face value bond with a $50 annual coupon payment trades at $900, its current yield would be 5.56% ($50/$900), higher than its 5% coupon rate. However, current yield overlooks potential capital gains or losses at maturity, making it an incomplete measure for long-term investment decisions.
Yield Spread
Yield spreads measure risk premiums between different bonds, typically calculated as the difference between a bond’s YTM and that of a risk-free reference bond with a similar maturity. These spreads reflect various risk factors:
- Credit Risk: Higher-risk bonds typically offer wider spreads to compensate investors for increased default probability.
- Liquidity Risk: Bonds that trade less frequently often provide higher yields to attract investors despite reduced marketability.
- Market Conditions: Economic factors, interest rate expectations, and market sentiment influence spread levels.
- Term Structure: The relationship between short-term and long-term yields affects spread calculations across different maturities.
By analyzing yield spreads, you can evaluate relative value opportunities and assess whether higher-yielding bonds offer adequate compensation for their additional risks.
How To Calculate Yield to Maturity
Standard Coupon Bonds
For standard coupon bonds, calculating YTM involves finding the interest rate that equates the present value of all future cash flows to the bond’s current market price. The formula incorporates regular coupon payments and the return of principal at maturity.
Semi-Annual Coupon Bonds
Many bonds pay interest semiannually, requiring a modified YTM calculation. The yield to maturity formula for these bonds divides the annual rate by two and doubles the number of periods until maturity.
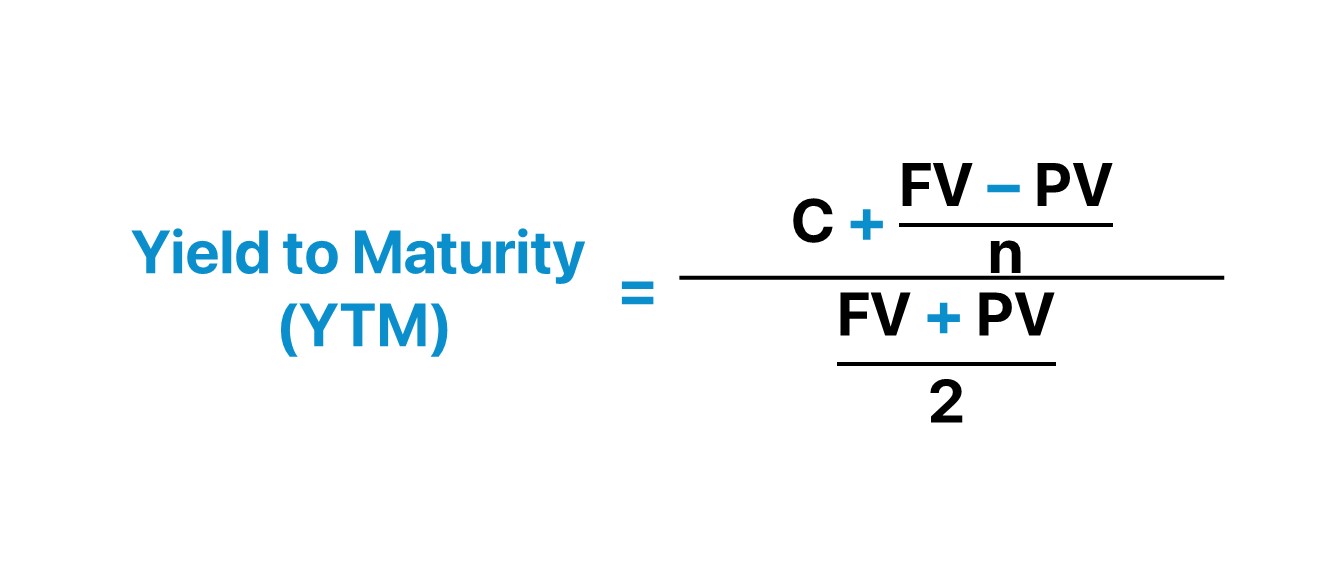
Yield to Maturity Formula
The YTM formula is expressed as:
YTM = [C + (F-P)/n] / [(F+P)/2]
Where:
- C = Annual coupon payment
- F = Face value
- P = Current price
- n = Number of years to maturity
This calculation requires iteration or financial calculators due to its complexity, as no direct algebraic solution exists for bonds with multiple coupon payments.
Factors Affecting Yield to Maturity
Several key factors influence a bond’s YTM:
- Market Interest Rates: Changes in prevailing rates affect bond prices and, consequently, their YTM. When market rates rise, bond prices typically fall, increasing their YTM.
- Credit Quality: Higher-rated bonds generally offer lower YTMs compared to lower-rated bonds, reflecting their reduced risk profile.
- Time to Maturity: Longer-term bonds often provide higher YTMs to compensate investors for increased interest rates and inflation risk.
- Price Relative to Par: Bonds trading at a discount typically offer higher YTMs than those trading at a premium, assuming all other factors remain constant.
Common Misconceptions About Yield to Maturity
Several misconceptions about YTM warrant clarification:
- YTM doesn’t represent guaranteed returns. The actual realized return may differ if coupon payments cannot be reinvested at the same rate.
- YTM calculations assume all payments occur as scheduled. Default risk or call provisions may alter actual returns.
- The relationship between price and YTM isn’t linear. A one-percentage-point change in price doesn’t correspond to a one-percentage-point change in YTM.
- YTM doesn’t account for tax implications, which can significantly impact actual returns for investors in different tax brackets.
Benefits of Understanding Yield to Maturity in Bond Evaluation
Understanding yield to maturity provides you with several advantages when evaluating fixed-income securities.
Accurate Bond Comparisons
YTM creates a standardized method for comparing bonds with different characteristics. Two bonds might appear similar based on their coupon rates, but their yields to maturity could vary significantly due to price differences or varying time horizons. This standardization allows you to identify bonds offering superior value relative to their risk levels.
Price Evaluation
YTM helps determine whether a bond’s market price represents fair value. By calculating the yield to maturity, you can assess if a bond trading at a premium or discount offers appropriate compensation for its risk level. This analysis proves particularly valuable when market conditions cause significant price fluctuations.
Portfolio Planning
Understanding YTM supports strategic portfolio construction by:
- Identifying bonds that align with specific investment objectives
- Evaluating whether current holdings meet return requirements
- Determining optimal hold periods for maximizing returns
- Assessing the impact of interest rate changes on portfolio value
Risk Assessment
YTM calculations incorporate multiple risk factors affecting bond investments:
- Interest rate risk through price sensitivity analysis
- Credit risk by comparing yields across different credit ratings
- Reinvestment risk by evaluating the likelihood of achieving similar returns on future investments
- Duration risk through time-to-maturity considerations
Market Insight
Changes in YTM across different bond categories provide valuable information about:
- Market expectations for future interest rates
- Economic conditions and growth prospects
- Credit market health and risk appetite
- Relative value opportunities between sectors
Boost Your Bond Investments With Above the Green Line
Above the Green Line’s comprehensive bond analysis tools help you evaluate YTM alongside other metrics to make informed investment decisions. Our membership platform provides access to advanced analytics and educational resources, empowering you to optimize your fixed-income portfolios. Visit our membership page to access professional-grade tools for bond analysis and portfolio management.

Related Articles
[pt_view id=”e2b53bb6zw”]