By Andrew Stowers
Updated May 12, 2026
IWM is one of the most traded securities on the planet — averaging over $5 billion in daily volume. But most investors who buy it think of it simply as a small-cap fund.
Active traders know it differently: as a real-time signal of domestic economic health, a market breadth indicator, and one of the cleanest instruments available for expressing a view on the U.S. economy versus global markets. It is simultaneously one of the most useful tactical trading vehicles in existence and one of the most misused buy-and-hold positions in retail portfolios.
This guide covers all of it — what IWM tracks, what drives its performance, how it compares to SPY and QQQ, why traders watch it as a market signal, and exactly where it belongs in your portfolio. For a more comprehensive overview on ETF investments, we encourage you to read through our ETF Investing Guide after finishing this article.
What Is IWM? Structure and How It Works
| Quick Answer
IWM is the iShares Russell 2000 ETF, managed by BlackRock and tracking the Russell 2000 Index — approximately 2,000 small-cap U.S. companies. It is one of the most liquid ETFs in the world, serving as the primary vehicle for small-cap equity exposure and a widely-watched indicator of domestic economic health. |
IWM tracks the Russell 2000 Index, a float-adjusted market-cap-weighted benchmark composed of approximately the smallest 2,000 stocks in the Russell 3000 Index. The Russell 3000 itself covers roughly 98% of the investable U.S. equity market, making the Russell 2000 a genuine small-cap cross-section of the domestic economy rather than a hand-picked list.
Index Construction and Annual Reconstitution
Companies in the Russell 2000 are ranked by float-adjusted market capitalization. The cutoffs shift annually — a company that grows into mid-cap territory is removed; stocks that drop in market cap can enter. This annual reconstitution, which occurs every June, creates a predictable trading event: index-tracking funds must buy newly added stocks and sell removed ones on the same effective date, causing meaningful price pressure in affected securities in the days surrounding the event. Active traders monitor reconstitution closely.
The Key Structural Difference: No Concentration
The most important structural fact about IWM: no single stock dominates. The largest individual holdings typically represent less than 0.5% of the fund. Compare this to SPY, where Apple alone accounts for approximately 7% of the index, or QQQ, where the top 10 holdings can represent over 50% of the fund. IWM’s performance reflects the collective health of 2,000 companies, not the fate of a handful of mega-caps.
What ‘small-cap’ means in practice: Russell 2000 companies typically have market caps between approximately $300 million and $2 billion at reconstitution. These are real, operating businesses — not micro-caps — but they are domestically focused companies at a stage of growth where they are far more sensitive to U.S. economic conditions than to global demand cycles.
IWM Key Facts and Fund Structure
| Data Note
All figures are approximate and subject to change. Verify current expense ratios, AUM, and volume at iShares.com before investing. |
The table below compares IWM directly with SPY and QQQ — the three most actively traded U.S. equity ETFs — on the dimensions that matter most for both investors and traders.
| Feature | IWM | SPY | QQQ |
|---|---|---|---|
| Issuer | BlackRock (iShares) | State Street (SPDR) | Invesco |
| Index Tracked | Russell 2000 | S&P 500 | Nasdaq 100 |
| Holdings Count | ~2,000 | ~503 | 101 |
| Expense Ratio | ~0.19% | ~0.0945% | ~0.20% |
| AUM | ~$65B+ (verify) | ~$540B+ (verify) | ~$280B+ (verify) |
| Avg Daily Volume | ~$5B+ | ~$20B+ | ~$15B+ |
| Largest Single Holding | <0.5% | ~7% (Apple) | ~9% (Apple) |
| Market-Cap Focus | Small-cap (~$300M–$2B) | Large-cap (~$10B+) | Large-cap tech (~$10B+) |
| Dividend Yield | ~1.0–1.5% | ~1.3% | ~0.6% |
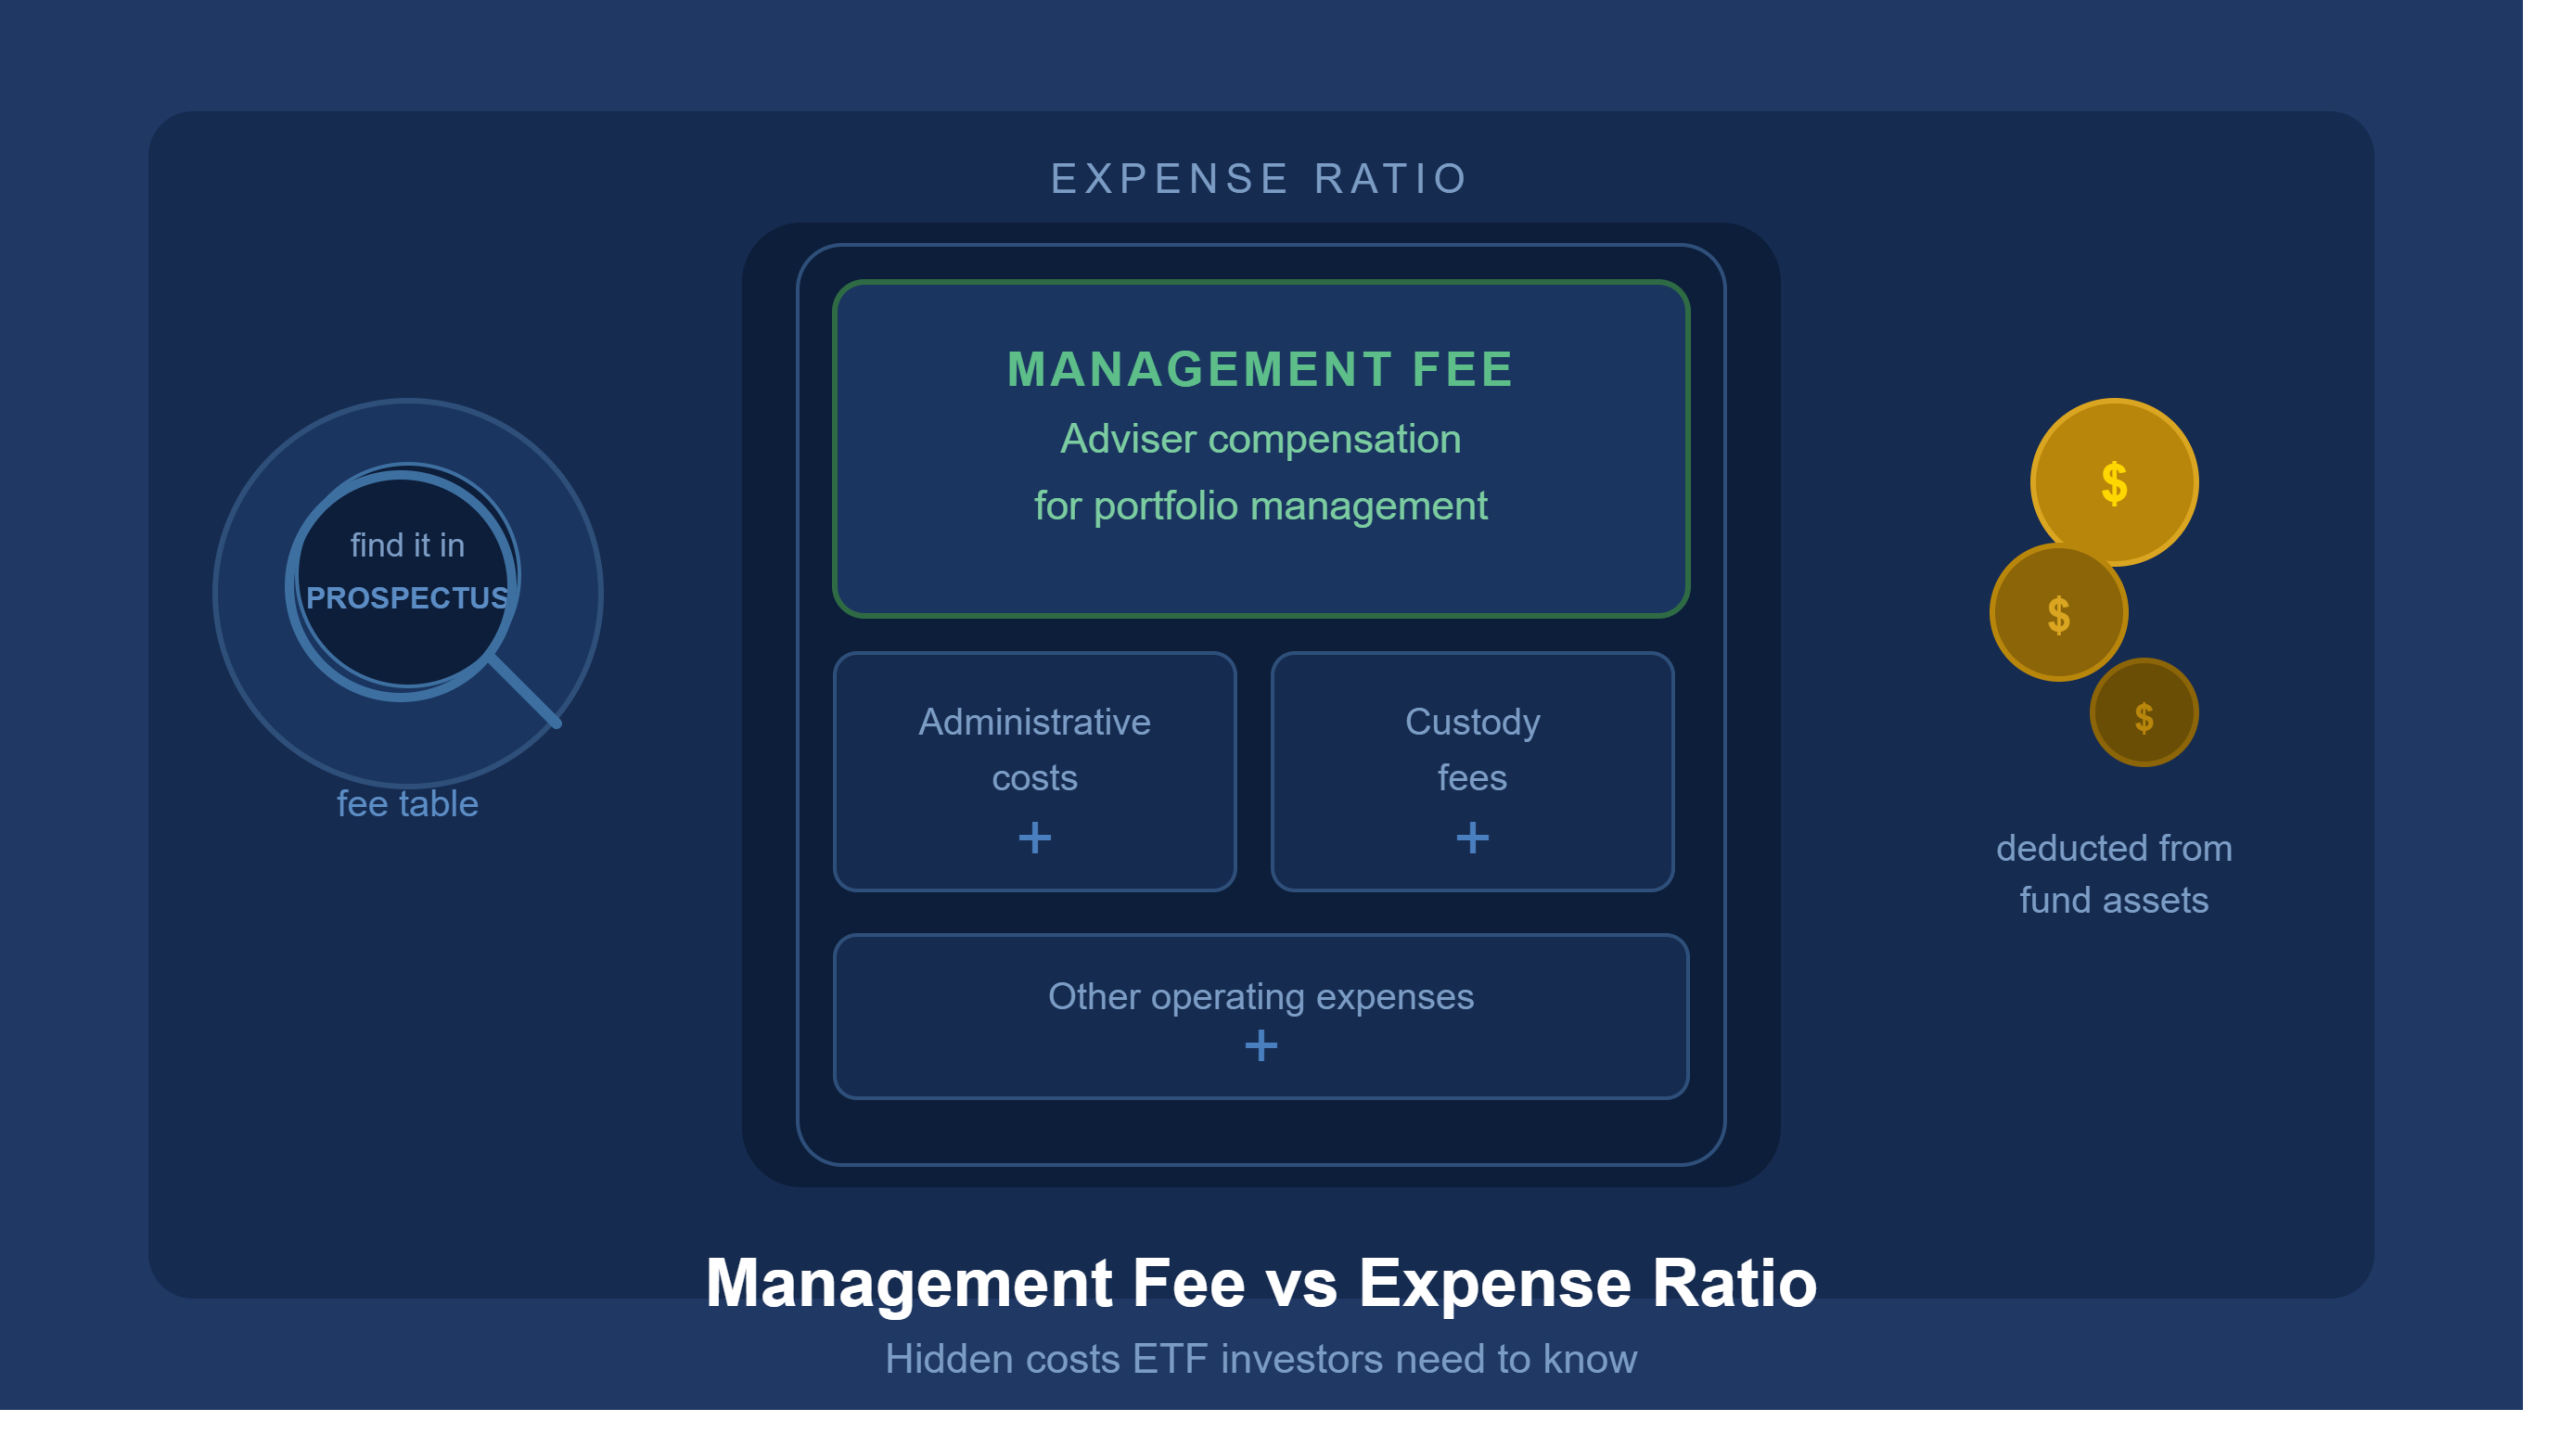
Expense Ratio: Matters More for Some Investors Than Others
For active traders who hold IWM for days or weeks, the 0.19% annual expense ratio is effectively irrelevant — a negligible fraction of the bid-ask spread and transaction cost. The liquidity is what matters, and IWM delivers this in abundance.
For long-term passive investors seeking buy-and-hold small-cap exposure, the cost picture is different. SCHA (Schwab U.S. Small-Cap ETF) charges approximately 0.03% and VTWO (Vanguard Russell 2000 ETF) charges approximately 0.10% — both tracking near-identical indices. The 0.09–0.16% annual cost difference compounds meaningfully over a 20–30 year holding period. Passive investors should run the numbers before defaulting to IWM.
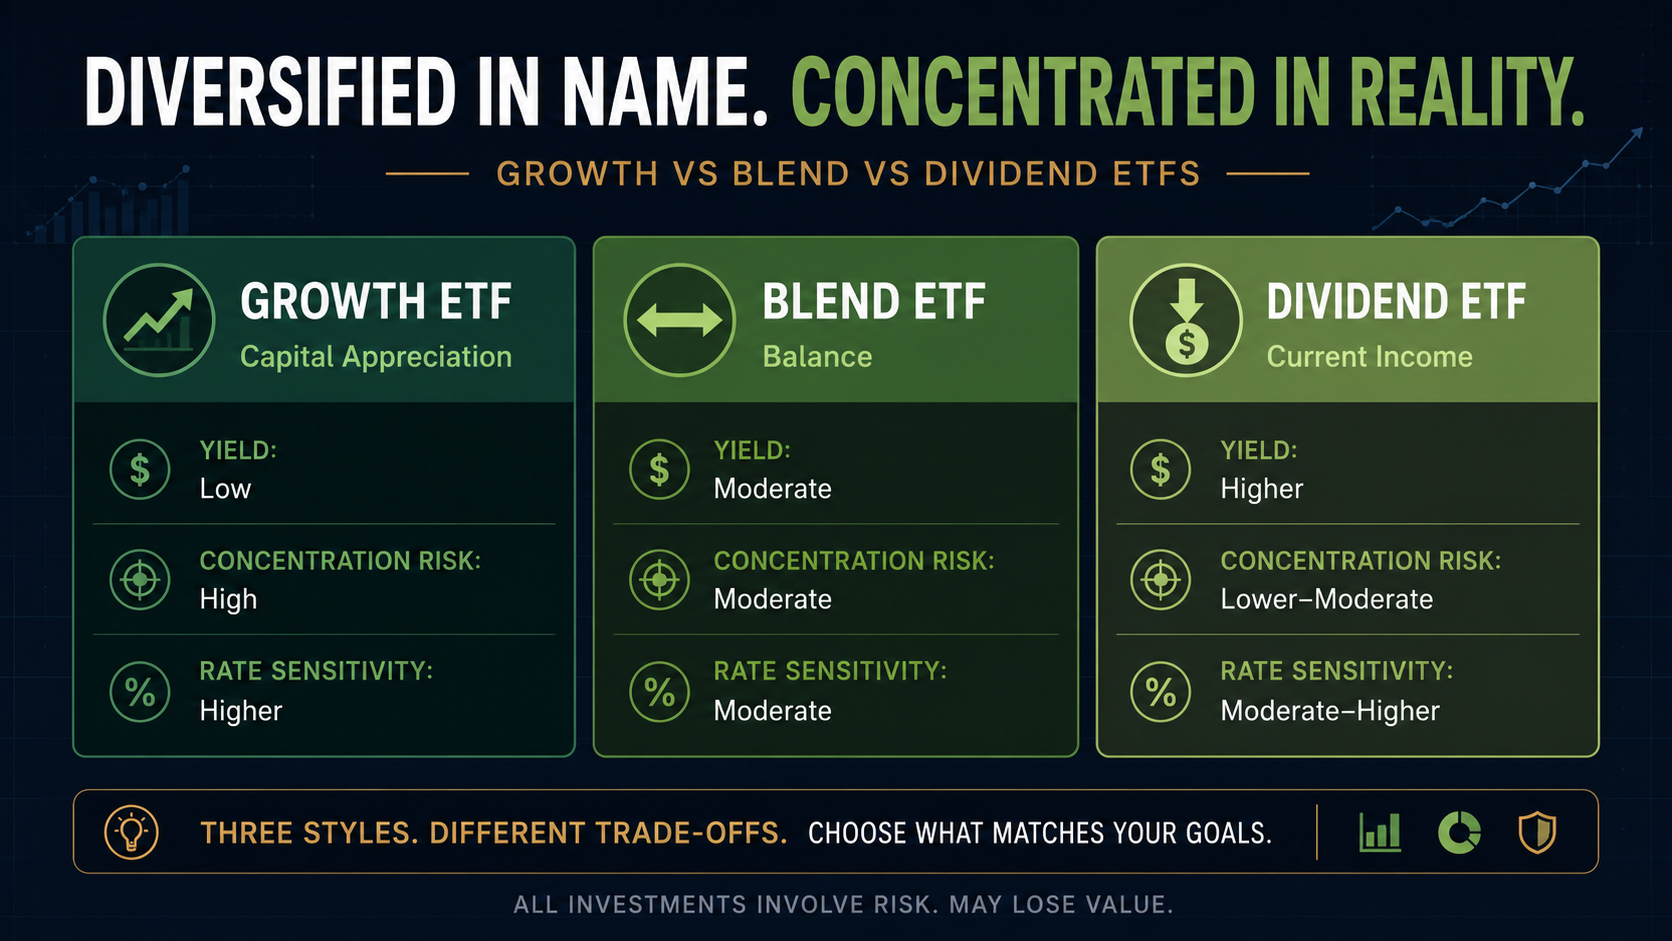
Russell 2000 Sector Breakdown: What You’re Actually Buying
IWM’s sector composition is meaningfully different from both SPY and QQQ — and understanding those differences explains a great deal about when IWM outperforms, when it underperforms, and what it signals about market conditions.
| Sector | IWM (Approx.) | SPY (Approx.) | Notable Difference |
|---|---|---|---|
| Financials | ~17% | ~13% | IWM = regional banks; SPY = megabank/insurance |
| Healthcare | ~15% | ~12% | IWM = biotech/specialty pharma; SPY = diversified |
| Industrials | ~15% | ~8% | IWM overweight domestic manufacturers |
| Technology | ~13% | ~32% | IWM underweight vs SPY; no mega-cap dominance |
| Consumer Discretionary | ~12% | ~10% | Similar; IWM skews smaller retailers |
| Real Estate | ~7% | ~2% | IWM overweight smaller REITs |
| Energy | ~5% | ~4% | IWM: smaller E&P companies |
| Other Sectors | ~16% | ~19% | Materials, Comm., Staples, Utilities |
Sector weightings change with quarterly rebalancing. Verify current composition at iShares.com.
What These Sector Differences Mean in Practice
Financials concentration: IWM’s ~17% financials weighting is dominated by regional banks — community and regional lenders that are far more sensitive to interest rate spreads, local economic conditions, and deposit flows than the JPMorgans and Bank of Americas in SPY. When regional banks face stress — as they did during the March 2023 regional banking crisis — IWM sells off disproportionately relative to the broader market.
Healthcare and biotech: IWM’s healthcare exposure skews heavily toward small-cap biotech and specialty pharmaceutical companies — names with binary clinical trial outcomes and limited revenue diversification. This creates higher healthcare volatility in IWM than the large-cap diversified healthcare exposure in SPY.
The domestic revenue bias: Russell 2000 companies derive approximately 70–80% of revenue from the U.S. domestic economy — significantly higher than the S&P 500 (~57%). This makes IWM a fundamentally domestic economic bet. A strong U.S. economy with robust domestic consumer spending benefits IWM regardless of what is happening in Europe, Asia, or emerging markets.
IWM vs SPY vs QQQ: Understanding the Differences
| One-Sentence Summary
IWM tracks 2,000 domestic small-cap companies heavily weighted in Financials, Healthcare, and Industrials. SPY tracks 500 large-cap companies with significant multinational revenue and technology dominance. QQQ tracks 100 large-cap technology-heavy Nasdaq stocks. They are not interchangeable broad-market proxies — each measures something different. |
When Each Outperforms
IWM outperforms at the beginning of economic recoveries — particularly when the Federal Reserve begins cutting interest rates. Lower rates reduce borrowing costs for small-cap companies, which carry proportionally more floating-rate debt than large-caps. Domestic economic expansion also disproportionately benefits domestically-focused small businesses. Early-cycle, post-recession recoveries have historically been IWM’s strongest performance periods.
QQQ outperforms in low-rate, growth-oriented bull markets where technology earnings drive multiple expansion. When interest rates are low, future cash flows are discounted less aggressively, boosting high-growth, high-valuation tech companies. QQQ’s performance is driven by a relatively small number of mega-cap tech earnings narratives (Apple, Microsoft, Nvidia, Meta, Alphabet).
SPY represents the balanced middle ground — large enough to capture mega-cap momentum but diversified enough to benefit from broad economic expansion. In periods of uncertainty, SPY is typically the default institutional allocation.
The Interest Rate Connection
Small-cap companies in the Russell 2000 carry meaningfully more variable-rate (floating-rate) debt relative to their size than large-cap S&P 500 companies. When the Federal Reserve raises rates, IWM faces a dual headwind: higher borrowing costs directly compress small-cap profit margins AND valuation multiples compress as discount rates rise. This is why IWM typically underperforms SPY and QQQ during rate-hiking cycles.
The reverse holds in rate-cutting cycles — IWM benefits from falling debt costs more directly than large-cap peers, which often have locked in fixed-rate long-term debt at lower rates.
Why Traders Watch IWM: The Small-Cap Market Signal
| The Most Important Thing About IWM
Active traders and portfolio managers watch IWM not only as an investment but as a market health signal. Small-cap leadership or lagging relative to large-caps is one of the most reliable indicators of the market’s internal health — and the IWM/SPY ratio is one of the most watched macro regime indicators available to any investor. |
IWM as a Market Breadth Indicator
Market breadth measures the participation of individual stocks in a market move. A rally led by a handful of mega-cap names while smaller stocks underperform is a narrowing rally — historically a warning sign that the advance lacks the broad-based participation needed for durability.
IWM provides a real-time read on small-cap participation. When IWM advances alongside SPY and QQQ, it confirms that the rally has broad market support — both mega-caps and small domestic companies are rising. When SPY and QQQ advance while IWM stalls or declines, it signals that the rally is narrowing to mega-cap concentration — a divergence that has preceded several notable corrections.
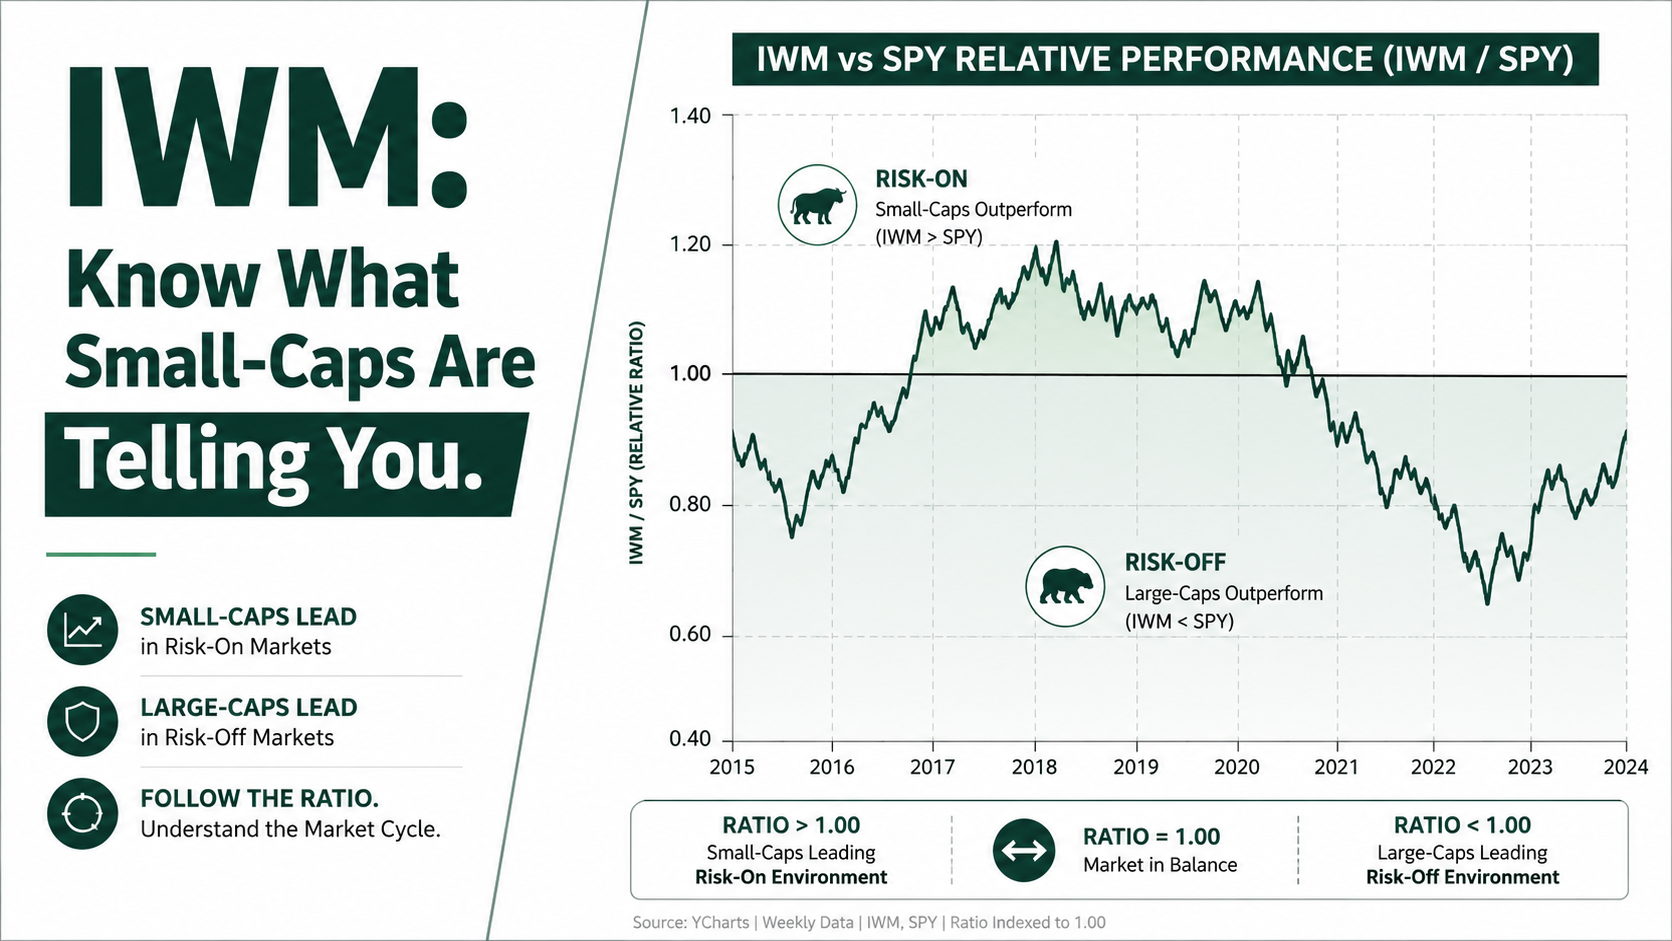
The IWM/SPY Ratio: A Practical Regime Signal
Plotting the ratio of IWM’s price to SPY’s price over time creates a relative performance line that many professional traders monitor as a macro regime indicator.
- Rising IWM/SPY ratio: small-caps are outperforming large-caps — signals broad risk-on sentiment, strong domestic economic optimism, and typically an early-to-mid economic expansion environment.
- Falling IWM/SPY ratio: large-caps are outperforming small-caps — signals flight to quality and mega-cap defensiveness, often characteristic of late-cycle slowdowns, rising rate environments, or risk-off periods.
- IWM/SPY divergence from the trend: when the ratio breaks a multi-month trend in either direction, it frequently precedes a broader market regime shift.
Reconstitution and Seasonal Patterns
The annual Russell 2000 reconstitution in June creates a predictable seasonal pattern. In the weeks preceding reconstitution, stocks being added to the index experience buying pressure as passive funds pre-position; stocks being removed face selling pressure. Active traders who track reconstitution candidate lists can express views on individual names or the broader rebalancing flow. This is a structural, calendar-driven opportunity that recurs annually.
How IWM Fits Into a Complete Portfolio
IWM serves materially different roles depending on how you invest — and being clear about which profile applies to you is the key to using it correctly.
Profile 1: Passive Long-Term Investor
If your goal is buy-and-hold small-cap exposure over 10–30 years, IWM’s 0.19% expense ratio is a meaningful consideration. The same Russell 2000 index exposure is available through VTWO (Vanguard Russell 2000 ETF) at approximately 0.10%, or near-identical small-cap exposure through SCHA (Schwab U.S. Small-Cap ETF) at approximately 0.03%.
The cost difference of 0.09–0.16% per year sounds small. On a $100,000 small-cap allocation over 30 years at 8% returns, the compounding impact of that fee differential is approximately $40,000–$60,000 in foregone growth. For a genuinely passive buy-and-hold allocation, SCHA or VTWO are the more cost-efficient instruments.
Profile 2: Active Trader
For active traders, IWM has no peer in the small-cap space. The $5B+ average daily volume, the extensive options market (one of the deepest of any ETF), tight bid-ask spreads, and the availability of weekly options contracts make IWM the dominant instrument for small-cap directional trades, hedges, and volatility expressions.
No other small-cap ETF comes close to IWM’s liquidity. The ability to enter and exit large positions with minimal slippage, construct complex options strategies with competitive pricing, and trade in extended hours at reasonable spreads makes IWM the professional-grade small-cap trading vehicle.
Profile 3: Core-Satellite Portfolio Builder
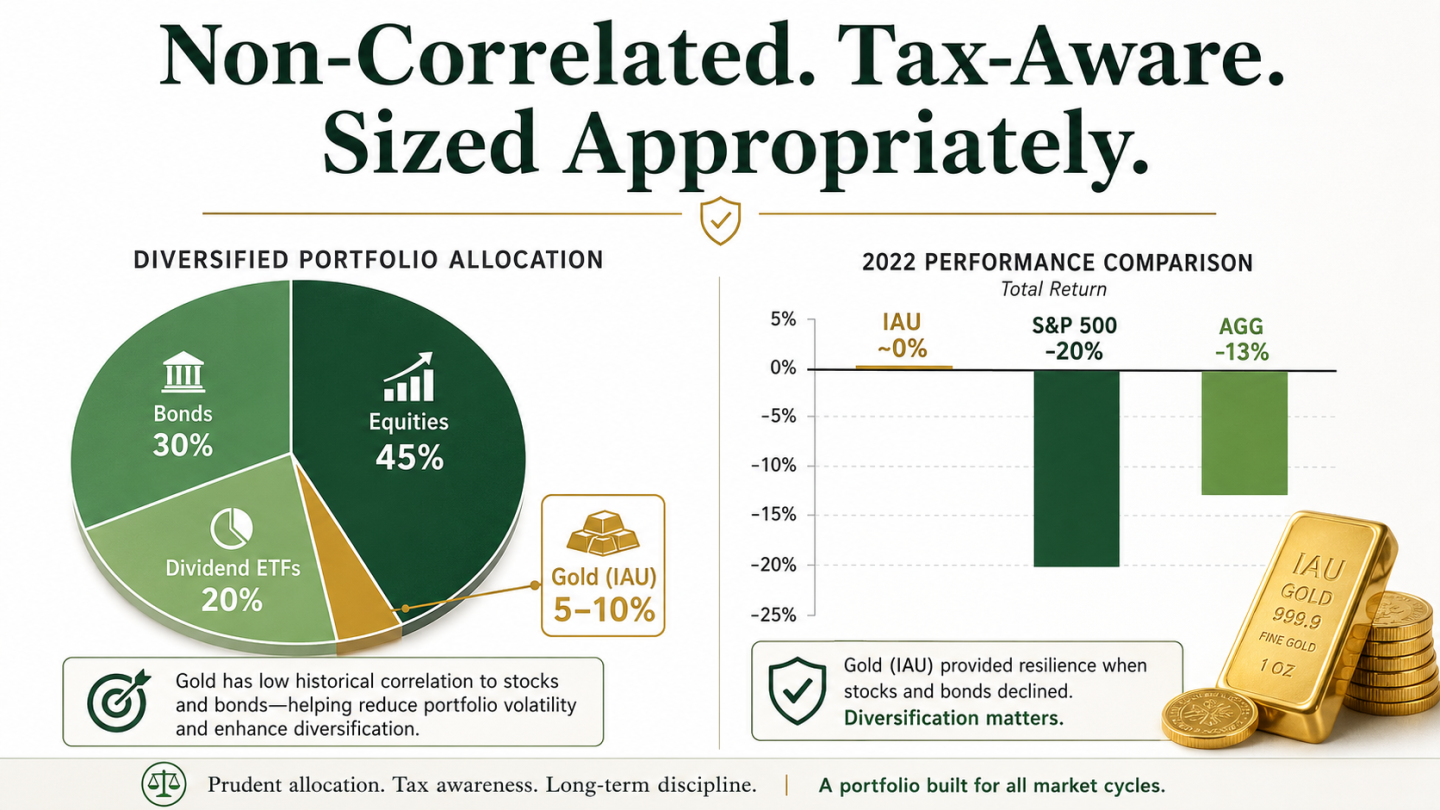
For investors building a diversified core-satellite portfolio, a 5–15% allocation to IWM alongside a large-cap core (SPY or VOO) adds the historically documented small-cap return premium — smaller companies have outperformed large-caps over most long-run historical periods — at the cost of meaningfully higher short-run volatility.
The practical guidance: time the IWM satellite allocation to the economic and rate regime. Overweight IWM in early-cycle recovery and rate-cutting environments. Reduce to neutral or underweight in late-cycle and rate-hiking environments when small-cap floating-rate debt sensitivity becomes a headwind.
The Bottom Line on IWM
IWM is not a generic equity ETF. It is a specific, highly purposeful instrument with a clear identity: the world’s most liquid small-cap vehicle, a domestic economic proxy, a market breadth signal, and a rate-cycle sensitive allocation tool — all in one ticker.
The decision framework:
- Passive long-term investor seeking small-cap exposure → consider SCHA (0.03%) or VTWO (0.10%) for lower cost with equivalent index exposure
- Active trader needing small-cap exposure or tactical hedging → IWM is the unequivocal choice for liquidity, options depth, and execution quality
- Core-satellite portfolio builder → a 5–15% IWM allocation adds small-cap factor premium; time it to the rate cycle
- Market analyst → watch the IWM/SPY ratio for regime signals; small-cap leadership or lagging tells you more about market health than the S&P 500 alone
Understanding what IWM is measuring — not just what it holds — is what separates investors who use it as a precision instrument from those who simply buy it as ‘the small-cap fund.’
| Use Every ETF With a System — Not a Guess
At AboveTheGreenLine.com we give investors and active traders the analytical framework to evaluate every ETF — what it tracks, what drives it, how it fits into a complete portfolio, and when the regime favours it. If you want the complete rules-based system for ETF selection and allocation, join us Above the Green Line. |
Frequently Asked Questions
What does IWM track?
IWM tracks the Russell 2000 Index, a float-adjusted market-cap-weighted index of approximately 2,000 small-cap U.S. companies. The Russell 2000 represents the smallest 2,000 stocks in the Russell 3000 Index, which covers approximately 98% of the investable U.S. equity market. The index reconstitutes annually each June, adding companies that qualify and removing those that have grown into the mid-cap range.
What is the expense ratio of IWM?
IWM charges an expense ratio of approximately 0.19% annually. For active traders holding the ETF for days or weeks, this cost is negligible. For long-term passive investors, lower-cost alternatives tracking near-identical indices are available: VTWO (Vanguard Russell 2000) at approximately 0.10% and SCHA (Schwab U.S. Small-Cap) at approximately 0.03%. Verify current figures at iShares.com and fund provider websites.
What is the difference between IWM and SPY?
IWM tracks approximately 2,000 domestic small-cap U.S. companies with heavy weightings in Financials, Healthcare, and Industrials. SPY tracks 500 large-cap companies including major multinationals with a large technology weighting. IWM is more sensitive to U.S. domestic economic conditions and interest rates; SPY reflects both domestic and global corporate earnings. No single stock dominates IWM; Apple alone represents approximately 7% of SPY.
Why do traders watch IWM?
Active traders and portfolio managers watch IWM as a market breadth and regime signal. The IWM/SPY ratio — comparing small-cap to large-cap performance — is a widely-watched macro indicator. A rising ratio signals broad market participation and risk-on domestic optimism. A falling ratio or divergence from large-cap advances signals a narrowing rally concentrated in mega-cap names, which has historically preceded broader market corrections.

Related Articles
[pt_view id=”fb2451fm3r”]