By Andrew Stowers
Updated May 23, 2026
Closed end funds offer something genuinely unusual in the investment world: the possibility of buying a dollar of assets for eighty-five cents. They often yield 8, 10, or even 12 percent annually. And they remain one of the least understood fund structures available — which is partly why the opportunity exists.
The high yields are real. So are the structural risks. The discount to NAV creates genuine value in some cases and is a warning signal in others. Understanding the difference requires going beyond the headline numbers to the mechanics that produce them — and the evaluation framework that separates genuine opportunity from yield illusion. If you find you want to learn more about ETF investing after reading through this article, we highly encourage you to review our ETF Investing Guide.
What Are Closed End Funds? The Structure That Sets Them Apart
| Quick Answer
A closed end fund (CEF) is an investment fund that raises a fixed amount of capital through an IPO, issues a set number of shares, and trades on stock exchanges like individual stocks. Unlike mutual funds or ETFs, new shares are not created to meet investor demand — the share count is fixed — and investors cannot redeem shares directly from the fund at Net Asset Value. |
The term ‘closed’ refers to the capital pool — not the trading market. A closed end fund is closed to new capital after its IPO. The manager invests that fixed pool according to the fund’s stated mandate, and the fund’s shares trade on the exchange continuously as investors buy and sell among themselves. The fund manager’s job is to manage the portfolio — not to create or redeem shares based on investor flows.
The NAV Per Share
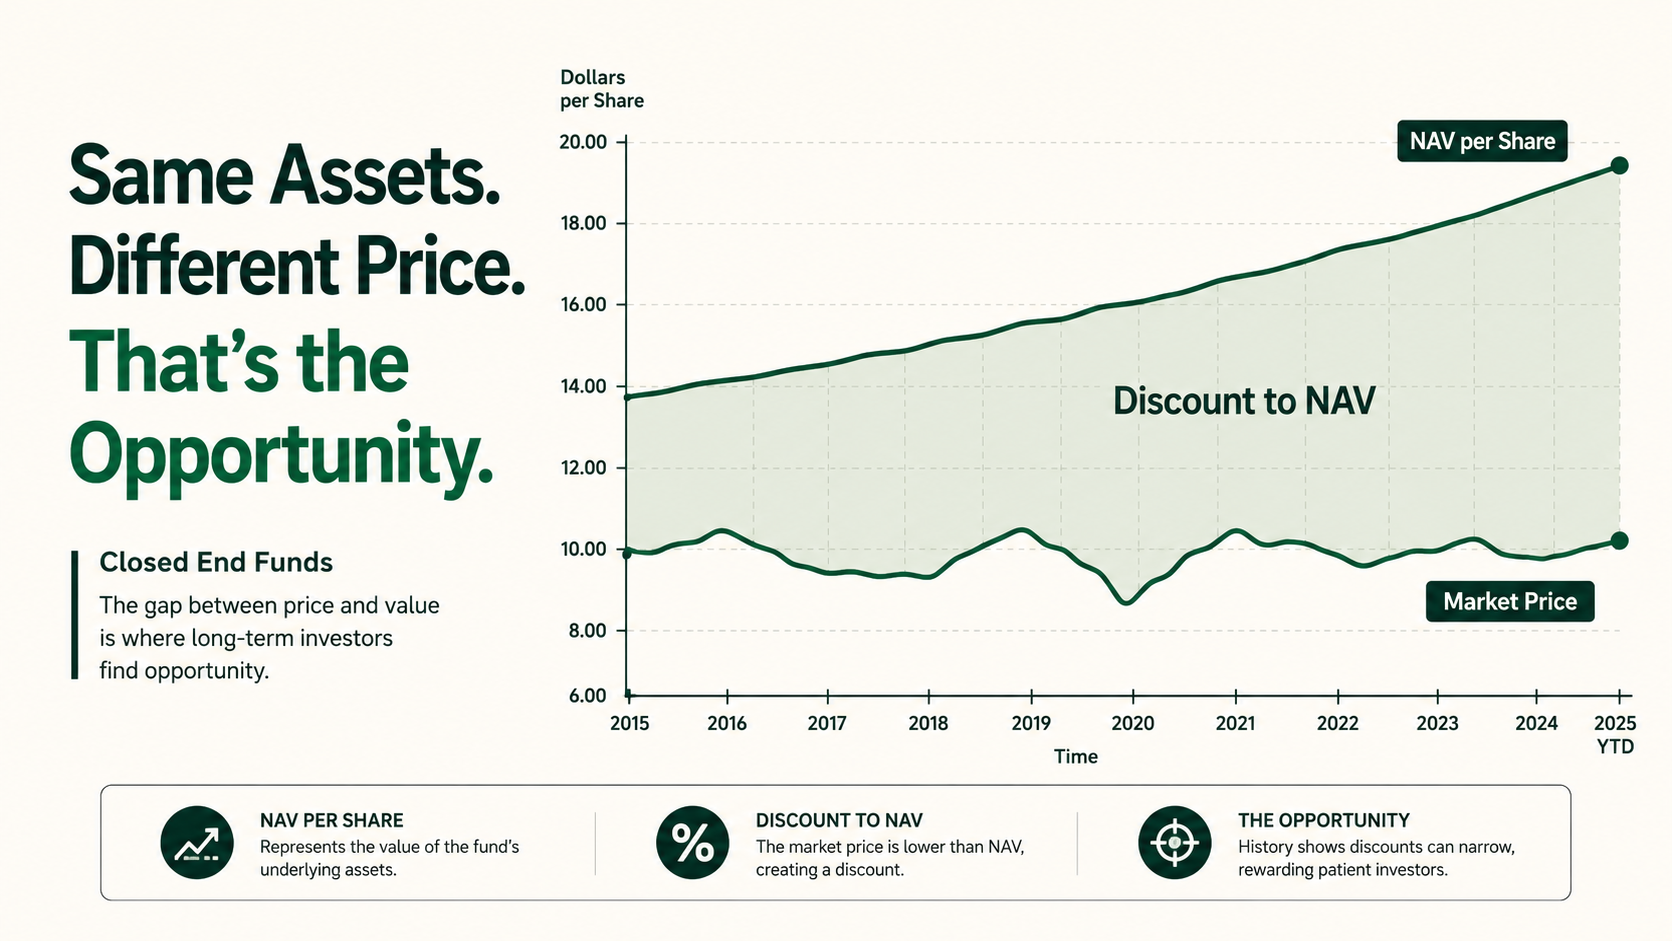
Every closed end fund has a Net Asset Value per share — the market value of its underlying portfolio holdings divided by the number of shares outstanding. This is the intrinsic value of what the fund owns. It is calculated daily by the fund and is publicly available. The NAV is what the fund’s investments are worth.
The market price is what the fund’s shares trade for on the exchange. These two numbers are related but not equal — and the relationship between them is the defining feature of the closed end fund structure.
Active Management Is the Norm
Unlike most ETFs, the vast majority of closed end funds are actively managed. The fund manager selects securities, adjusts allocations, and makes tactical decisions within the fund’s stated mandate. This active management is part of what justifies the typically higher expense ratios — though the active management benefit should be evaluated against the cost, as with any active strategy.
The NAV Discount and Premium: The Feature That Defines Closed End Funds
| The Core Concept
If a closed end fund holds $10.00 of assets per share but trades at $8.50, it trades at a 15% discount — investors are buying $1.00 of assets for $0.85. If the same fund traded at $11.00, it would trade at a 10% premium. Discounts are the norm for most CEF categories; premiums signal either exceptional demand or overvaluation. |
Discount calculation: (Market Price − NAV) / NAV × 100. A negative result is a discount; positive is a premium. The discount level — and whether it is wider or narrower than the fund’s historical average — is the most important valuation signal for any CEF investor.
Why Discounts Persist — The Absence of Arbitrage
ETFs have a price-correction mechanism called creation/redemption: when an ETF trades at a premium, authorised participants buy the underlying securities and exchange them for new ETF shares, selling those shares into the premium; when it trades at a discount, they buy ETF shares and redeem them for the underlying. This arbitrage keeps ETF prices within a few basis points of NAV.
Closed end funds have no equivalent mechanism. There is no authorised participant process, no creation/redemption. When a CEF trades at a discount, there is no structural force to narrow it. Investors must wait for market sentiment to improve, for a tender offer, or for the fund to announce a buyback — none of which are guaranteed or timely.
Why Discounts Develop
CEF discounts are not random. Common drivers include: institutional underownership (many funds are restricted from holding leveraged vehicles), leverage-related risk premiums (investors demand a discount to compensate for amplified downside), distribution sustainability concerns (investors discounting a future distribution cut), and structural selling pressure from certain distribution reinvestment programs.
Why Premiums Develop — and Why They Are Dangerous
Premiums typically reflect strong recent performance, a unique strategy with no ETF equivalent, or a high-profile manager attracting retail demand. Buying at a premium is structurally unfavourable: you are paying more than the assets are worth, and if sentiment shifts, the fund can return to a discount — creating a double loss (NAV decline plus discount expansion).
Historical Context
Many fixed income CEF categories have traded at persistent discounts for decades. The average taxable fixed income CEF has historically traded at 5-10% below NAV; municipal bond CEFs often at 3-8% below NAV. Discounts tend to widen during market stress and narrow during risk-on environments — tracking discount history is the most powerful valuation tool available to CEF investors.
Closed End Funds vs ETFs vs Mutual Funds: The Structural Differences
Closed end funds, ETFs, and open-end mutual funds are all investment funds — but their structural differences have profound implications for pricing, liquidity, and strategy execution.
| Feature | Closed End Fund | ETF | Open-End Mutual Fund |
|---|---|---|---|
| Share Count | Fixed at IPO | Flexible (creation/redemption) | Flexible (daily flows) |
| Price Mechanism | Market supply/demand | Arbitrage near NAV | End-of-day NAV |
| Can Redeem at NAV | No — must sell on exchange | Yes (APs) / Exchange trade | Yes — directly from fund |
| Premium/Discount Risk | Yes — persistent | Minimal | None (priced at NAV) |
| Leverage Allowed | Yes — commonly used | Rarely (3x ETFs are separate) | Limited |
| Management Style | Usually active | Usually passive | Active or passive |
| Intraday Trading | Yes | Yes | No (end-of-day only) |
The ETF arbitrage mechanism is the most practically important structural difference. An ETF that traded at a 10% discount would be immediately arbitraged away by professional traders buying cheap ETF shares and redeeming them for the underlying assets. CEFs have no such force — their discounts are real and persistent.
For investors choosing between a CEF and an ETF covering similar assets, the relevant questions are: does the CEF’s income advantage (typically from leverage) justify the premium, discount, and structural risks compared to a cheaper, more transparent ETF alternative?
Leverage: Why Closed End Funds Pay Such High Distributions — and the Hidden Risk
| The Income Math
A fixed income CEF with a portfolio yielding 6% and 30% leverage effectively deploys $1.30 of assets per $1.00 of equity. On $1.30 in assets at 6%, the gross income is $0.078 — a 7.8% return on equity before borrowing costs. After paying, say, 4% on the borrowed 30 cents, net income is approximately 6.9% on equity capital — meaningfully above the unleveraged 6%. |
How Closed End Fund Leverage Works
Most CEFs borrow through one of two mechanisms: issuing preferred shares (a senior security paying a fixed dividend, sold to institutional investors, sitting above common shares in the capital structure) or through short-term borrowing facilities (repurchase agreements, bank lines of credit). In both cases, the fund borrows at a lower short-term rate and invests in longer-duration, higher-yielding assets, capturing the spread.
Typical leverage ratios in the fixed income CEF universe range from 20-40% of net assets — meaning for every $1.00 of equity capital, the fund invests $1.20 to $1.40 of total assets. The Investment Company Act limits most regulated CEFs to leverage below 50% of net assets.
The Rate Environment Risk
When short-term borrowing rates rise — as occurred sharply in 2022 — the cost of the leverage increases, compressing the spread and reducing net income available for distribution. Some fixed income CEFs were forced to cut their distributions during 2022 as short-term rates rose 4-5% against portfolios locked into lower-yielding long-term bonds. The income math that worked at 1% borrowing rates stopped working at 5%.
Leverage Amplifies NAV Volatility
Leverage magnifies both income and losses. A CEF with 30% leverage will see its NAV fall approximately 1.3 times as much as an unleveraged fund holding identical assets. During market stress, this NAV decline typically causes discount widening simultaneously — the double-negative effect that is the primary risk of leveraged CEF ownership during adverse markets.
The Return of Capital Distribution Trap
This is the risk most CEF investors underestimate. A high stated distribution rate may include a significant return of capital component — where the fund pays out more than its net investment income by returning investor principal.
Example: a fund with a 10% stated distribution yield, actual investment income of 6%, and ROC of 4% is effectively returning $400 of your own $10,000 investment annually while calling it income. The capital base erodes, future income potential decreases, and the stated yield becomes increasingly misleading over time.
The key monitoring metric: distribution coverage ratio. When a fund’s net investment income covers 100% or more of its stated distribution, the payout is sustainable from genuine income. Coverage below 100% means ROC is supplementing — a warning that requires investigation of the fund’s strategy and management intent.
The Main Types of Closed End Funds
The CEF universe spans six primary categories, each with distinct income sources, leverage profiles, and interest rate sensitivities.
1. Municipal Bond CEFs
The largest and most mainstream CEF category. These funds invest in state and local government debt, generating federal tax-exempt income — making them particularly attractive for investors in the 32%+ federal tax brackets. Moderate leverage is typical (20-35%). Major issuers include Nuveen (the largest muni CEF manager), BlackRock, and PIMCO. Historical average discounts in the 3-8% range make this a relatively accessible entry point for new CEF investors.
2. Taxable Fixed Income CEFs
Invest in corporate bonds, high yield debt, emerging market bonds, and structured credit. Higher pre-tax yields than muni funds. Significantly more sensitive to credit cycles — high yield CEFs in this category can behave like equity in risk-off environments. Major managers: PIMCO (known for aggressive leverage in flagship funds), DoubleLine, and Western Asset.
3. Equity Income CEFs
Invest in dividend-paying equities and frequently use a covered call overlay to generate option premium income. Total return depends on both the underlying equity portfolio and the efficiency of the covered call strategy. Popular in low-rate environments when investors seek equity-like income without pure equity risk.
4. Senior Loan / Floating Rate CEFs
Invest in leveraged bank loans — senior secured corporate debt that pays floating-rate interest (tied to SOFR or similar benchmarks). Distribution rates adjust as rates change — providing a natural hedge against rising interest rates that fixed-rate bond CEFs lack. When short-term rates are high, these funds can offer attractive distribution rates without fixed-rate duration risk.
5. Real Estate and Infrastructure CEFs
Invest in REITs, infrastructure assets, or real property through operating company structures. Provide income and inflation-linkage from real assets. Less common than fixed income CEFs but serve investors seeking alternative income sources beyond corporate and government bonds.
6. Specialty / Multi-Asset CEFs
Cover preferred securities, MLPs (master limited partnerships), convertible bonds, event-driven strategies, and multi-asset income approaches. Often address specific income needs not met by available ETFs — the unique strategy angle is sometimes what drives premium pricing for specialty CEFs.
How to Evaluate a Closed End Fund: A Five-Metric Framework
| The Evaluation Anchor
Closed end funds cannot be evaluated on headline yield alone — the yield may include return of capital, may be unsustainable, and may come with leverage risk that is not visible in the distribution number. These five metrics give you the complete picture. |
Metric 1: Current Discount vs Historical Average
Compare today’s discount to the fund’s 1-year, 3-year, and 5-year average discount. A fund that typically trades at 5% below NAV but is currently at 12% presents a wider-than-normal margin of safety — and potential return from discount narrowing. A fund trading at a smaller-than-usual discount, or at a premium, has the opposite risk profile.
Tool: CEFConnect.com — a free resource providing historical discount data, distribution histories, and leverage information for the entire CEF universe. Note that it is operated by Nuveen (a major CEF issuer), so cross-reference fund-specific data with independent sources.
Metric 2: Distribution Coverage Ratio
The percentage of the stated distribution covered by net investment income (NII). Source: fund semi-annual and annual reports. Coverage above 100% means income is fully supporting the distribution — a sustainable payout. Coverage consistently below 80% suggests significant ROC supplementation and warrants investigation of whether management intends to maintain the distribution rate or cut it.
Metric 3: Leverage Ratio
Total assets divided by net assets. A ratio of 1.30 means 30% leverage. Higher leverage amplifies both income and NAV volatility. In the context of the interest rate environment, evaluate whether the current spread between borrowing cost and portfolio yield is sustainable — and what happens to distribution coverage if short-term rates increase by 1-2%.
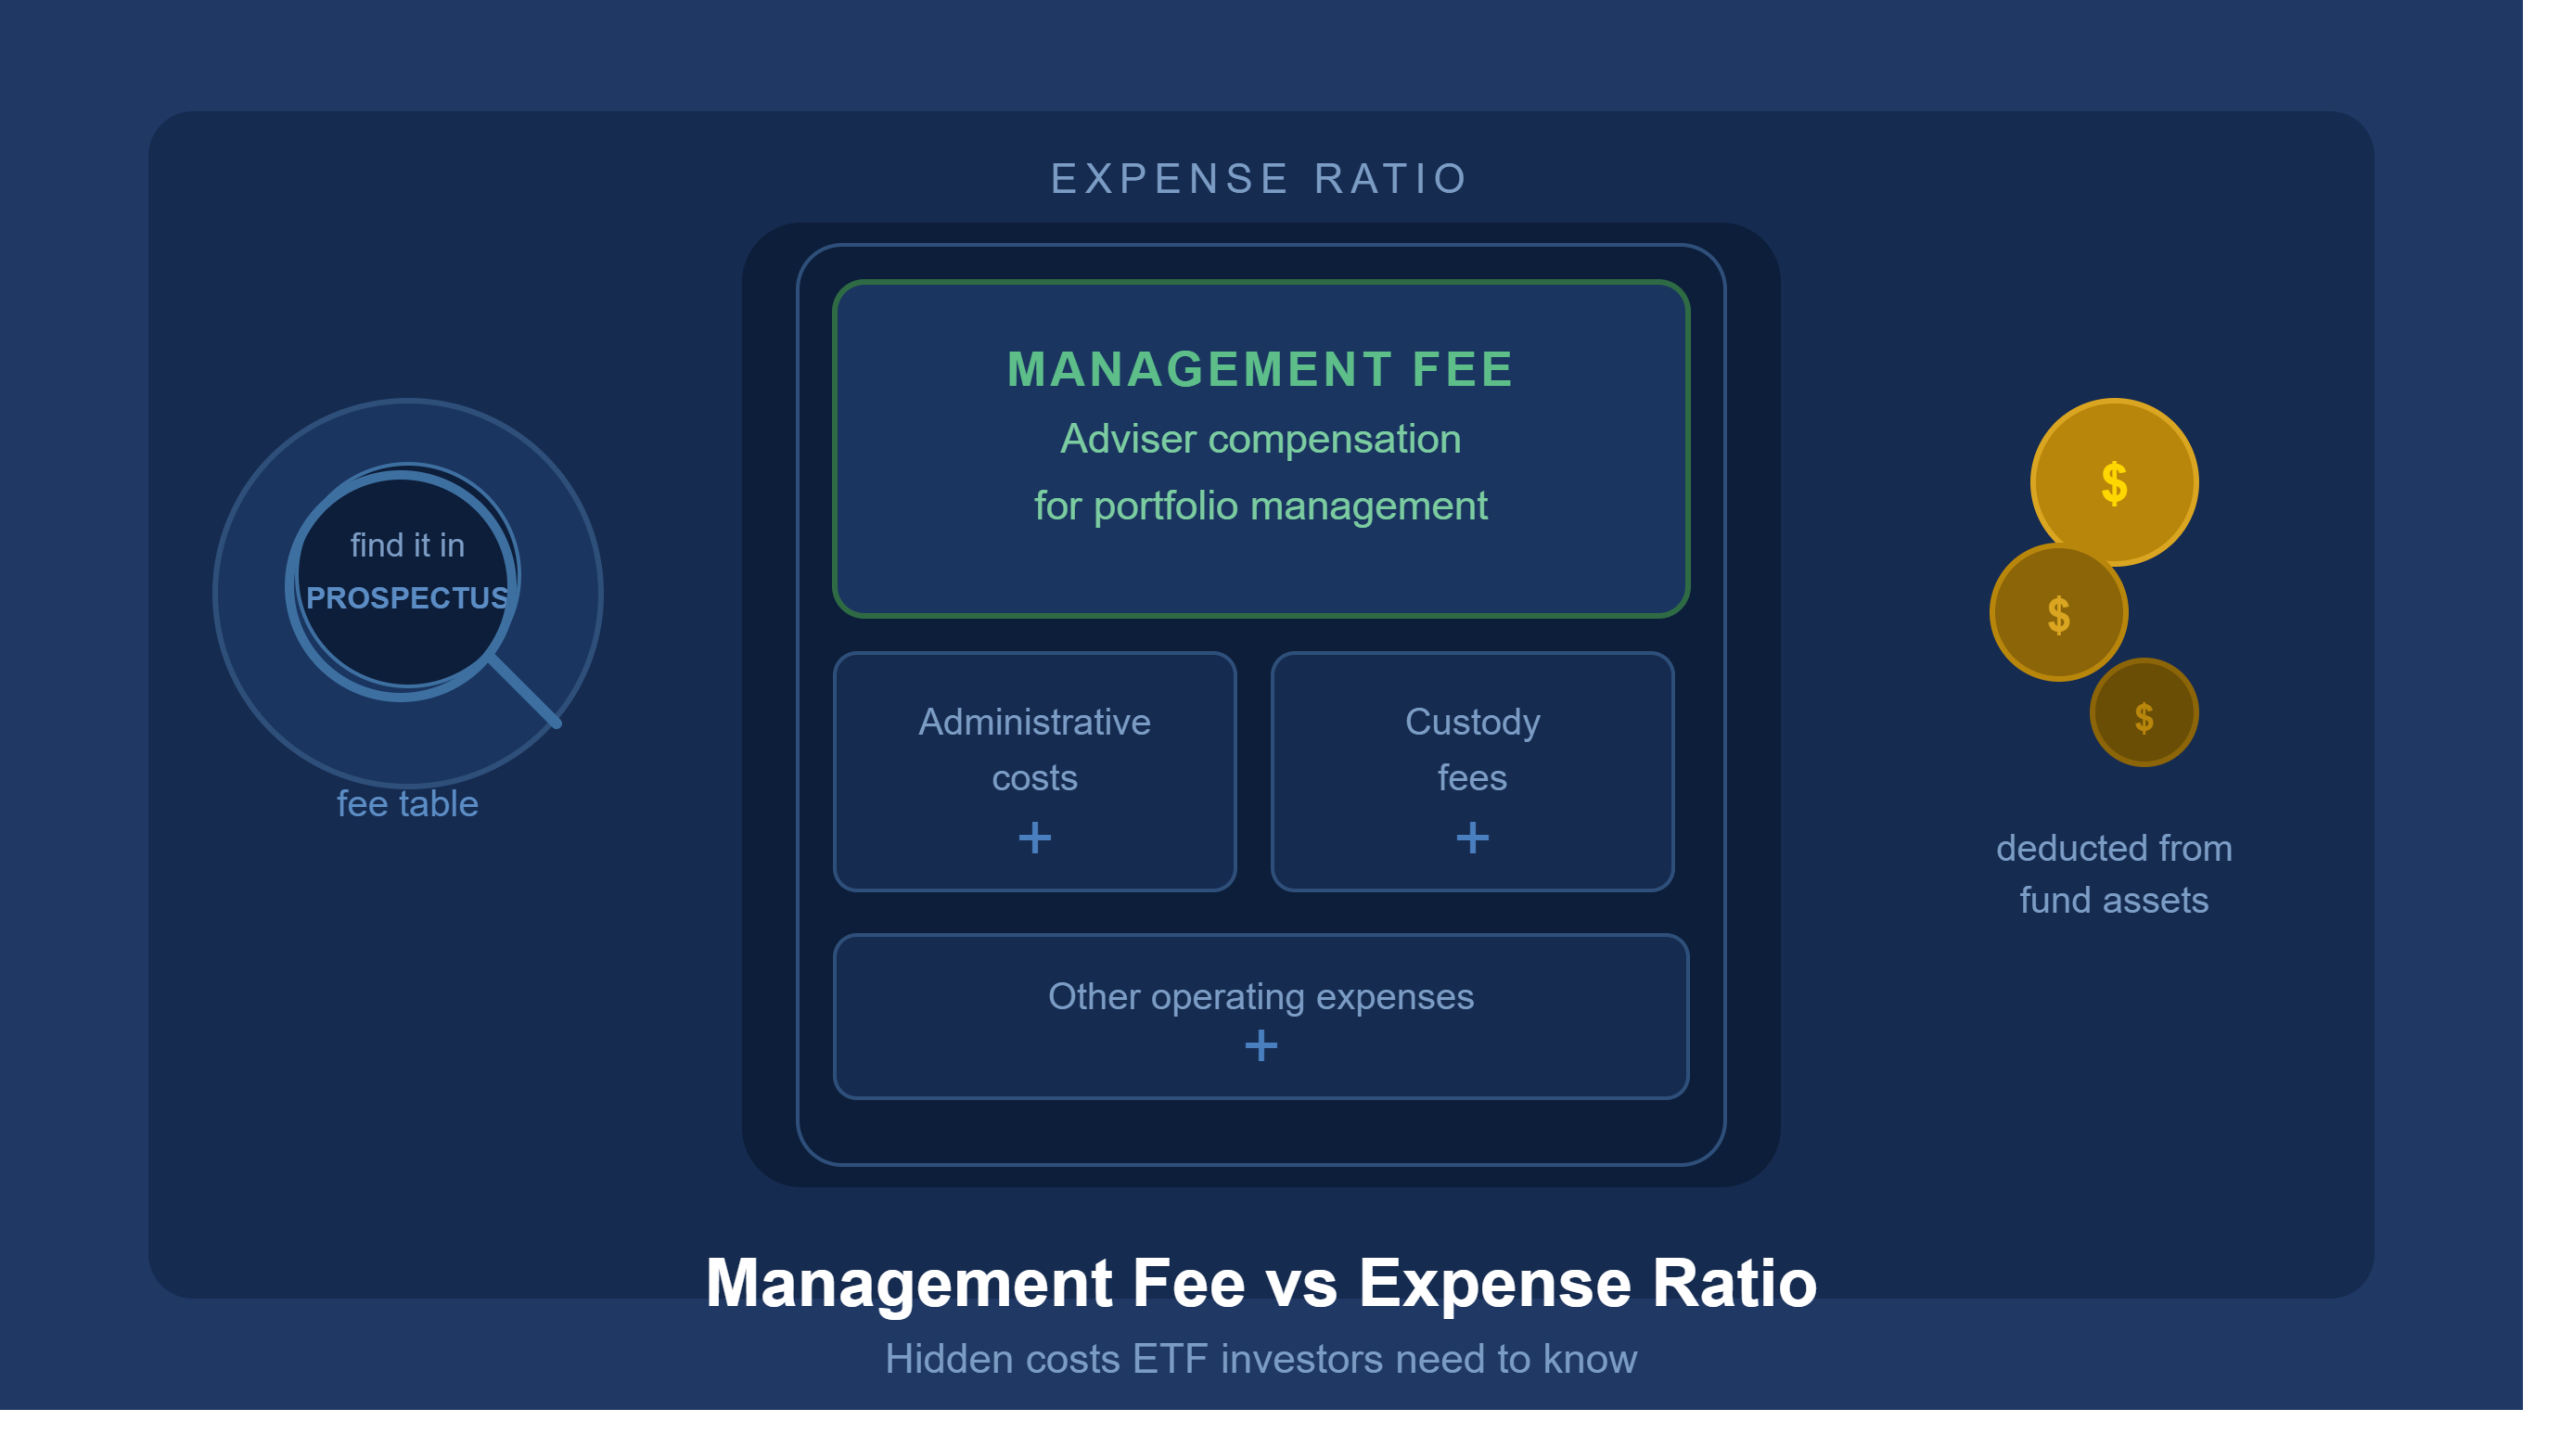
Metric 4: Expense Ratio (Total Cost Including Leverage Cost)
The management fee alone understates the true cost of a leveraged CEF. Total cost of ownership includes the management fee plus the cost of leverage (interest paid on borrowings). Effective all-in expense ratios for leveraged fixed income CEFs are often 1.5-2.5% annually — significantly higher than comparable bond ETFs at 0.04-0.15%. The leverage income benefit must clear this cost hurdle to create value for investors.
Metric 5: Portfolio Quality
Review the fund’s actual holdings: credit quality distribution (if fixed income), sector diversification, average maturity/duration, geographic exposure, and alignment with the stated mandate. Fund semi-annual reports (filed with the SEC as Form N-CSR) contain full portfolio disclosures. For fixed income CEFs, ensure the portfolio quality is consistent with the fund’s marketed risk profile — leverage on a lower-quality portfolio creates compounded risk.
How Closed End Funds Fit in a Complete Portfolio
Closed end funds serve investors with specific income and valuation-awareness objectives most effectively — not as core portfolio holdings for all investors.
Profile 1: Income-Focused Investor
Municipal bond CEFs in taxable accounts provide higher federally tax-exempt income than comparable bond ETFs, particularly when the investor is in a 32%+ federal tax bracket. The tax equivalency calculation: a 5% muni CEF yield in the 37% bracket is equivalent to approximately 7.9% taxable yield — competitive with many high yield options at meaningfully lower credit risk.
Monitor distribution coverage and leverage quarterly. Accept that NAV and discount may be volatile in the short term while income continues to be generated — a genuine income stream despite price volatility is a valid income investment outcome.
Profile 2: Tactical Discount Opportunity Buyer
Sophisticated investors monitor historical discount levels for high-quality CEF categories. When market stress — a credit event, rising rates, or broad risk-off selling — widens discounts significantly beyond historical averages, entry provides a margin of safety and the potential return from discount narrowing as conditions stabilize.
This is a patient, opportunistic approach requiring active monitoring through tools like CEFConnect. It is not a buy-and-hold strategy — exits are appropriate when discounts return to or near historical averages, or when distribution sustainability concerns emerge.
Profile 3: Core-Satellite with ETF Core
A CEF satellite positioned alongside an ETF core adds active income generation for specific yield objectives without replacing the passive core. Example: 85% broad market ETFs (SPY, BND) + 15% income-focused CEF satellite (municipal bond CEF for tax-exempt income, senior loan CEF for floating-rate exposure). The satellite improves total portfolio income without exposing the entire portfolio to CEF-specific risks.
Risk Limits and Monitoring
Set a maximum CEF allocation consistent with your leverage tolerance — typically 5-15% of a fixed income allocation for conservative investors, up to 20-25% for investors comfortable with leveraged income vehicles. Monitor discount levels, distribution coverage, and leverage ratio at least quarterly. In market stress, expect wider discounts without panicking — but distinguish between temporary discount widening and genuine distribution sustainability deterioration.
The Opportunity Is Real — So Is the Complexity
Closed end funds offer something genuinely distinctive: professionally managed portfolios at a discount to their underlying value, often generating high income through leverage on strategies that passive ETFs cannot replicate.
The framework in brief:
- Buy assets below intrinsic value when high-quality CEFs trade at wider-than-historical discounts
- Monitor distribution coverage — a 10% yield that is 4% income and 6% return of capital is not a 10% yield
- Understand leverage: amplifies income in stable rates, amplifies NAV loss in adverse environments, and widens discounts during stress — the triple risk
- Use the five-metric framework: discount vs history, coverage ratio, leverage ratio, total expense ratio, portfolio quality
- Municipal bond CEFs belong in taxable accounts; taxable fixed income CEFs belong in tax-advantaged accounts
- Core-satellite approach: ETF core for low-cost broad exposure + CEF satellite for specific income objectives
Closed end funds reward investors who do the work — who track discounts, read fund reports, and understand what is actually driving the distribution. For investors willing to apply that analysis, they offer income advantages that few other vehicles can match.
| Build a Complete Investment Framework With ATGL
At AboveTheGreenLine.com we give investors the analytical tools to evaluate every investment vehicle — from ETFs and closed end funds to individual securities. If you want the complete system for building income-generating, rules-based portfolios, join us Above the Green Line. |
Frequently Asked Questions
Are closed end funds a good investment?
Closed end funds can be a good investment for income-focused investors who understand their structure. Key advantages include access to high distribution yields (amplified by leverage), the opportunity to buy quality funds at discounts to underlying asset value, and active management of income-focused strategies that passive ETFs cannot replicate. Key risks include leverage amplifying losses during stress, discounts widening beyond historical norms, and distributions that include return of capital rather than true investment income. Suitability depends entirely on understanding these mechanics.
What is NAV discount in a closed end fund?
A NAV discount occurs when a closed end fund’s market price is below its Net Asset Value — the per-share value of its underlying holdings. If a CEF holds $10.00 of assets per share but trades at $8.50, it trades at a 15% discount. This means buying $1.00 of assets for $0.85 — a potential opportunity if the discount narrows toward historical averages, but also a risk if the discount widens further during market stress.
How do closed end funds pay such high dividends?
Closed end funds typically pay high distributions through three mechanisms: leverage (borrowing to invest more than equity capital, amplifying income on the larger asset base), active targeting of high-income assets (high yield bonds, senior loans, dividend stocks, covered call writing), and managed distribution policies that may include return of capital when investment income alone is insufficient. Always verify the distribution coverage ratio — income covering 100%+ of the stated distribution confirms genuine income; below 100% signals partial return of capital.
What is the difference between a closed end fund and an open end fund?
Open-end funds (mutual funds and most ETFs) continuously create and redeem shares — investor flows are met by creating new shares or redeeming existing ones at NAV. Closed end funds issue a fixed number of shares at IPO and do not redeem them — investors buy and sell on the exchange at market prices that may differ significantly from NAV. Closed end funds can use leverage more aggressively, often trade at persistent discounts, and are typically actively managed, while open-end funds are repriced at NAV and have no persistent discount/premium risk.

Related Articles
[pt_view id=”fb2451fm3r”]