By Andrew Stowers
Updated May 19, 2026
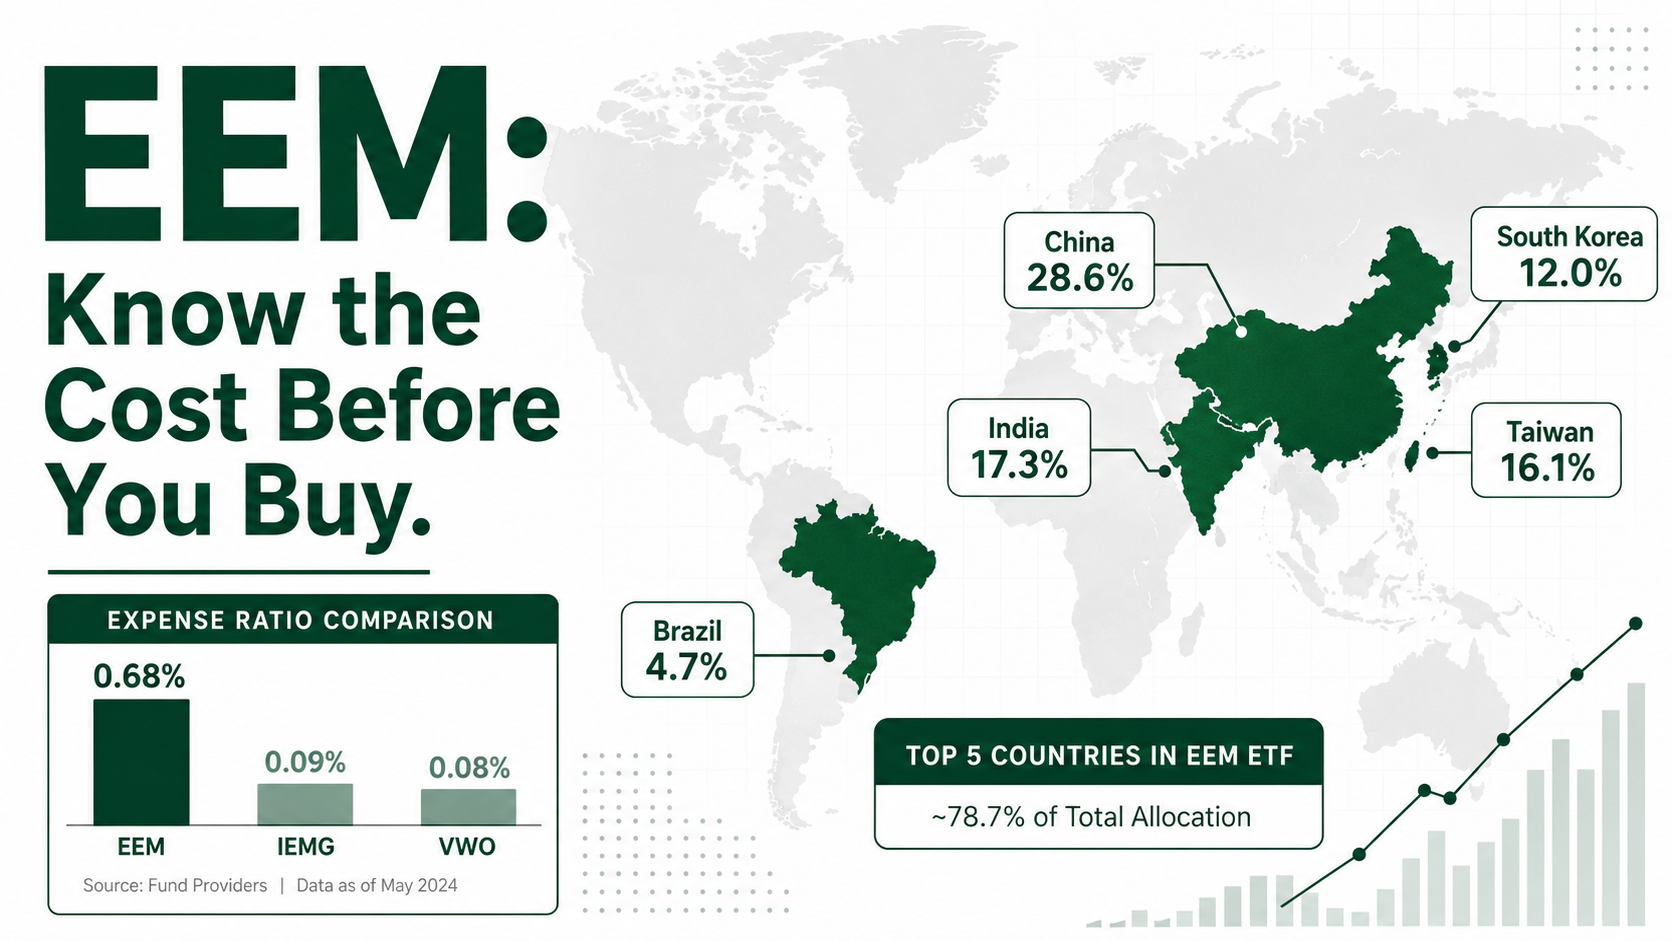
EEM is one of the most recognized ETF tickers in the world and one of the most traded. It is also, for many investors, an expensive habit.
At 0.68% annually, EEM charges nearly eight times what iShares’ own near-identical alternative — IEMG — charges for the same core emerging market exposure. For active traders and institutions, that cost is irrelevant; the liquidity is what matters. For passive investors building a long-term portfolio, it represents a compounding drag that accumulates into a significant sum over time.
This guide covers both sides of that equation — what EEM actually holds, the China concentration that shapes so much of its risk profile, the cost comparison that most investors never see laid out clearly, and how to decide whether EEM or one of its alternatives is the right vehicle for your situation. For further learning, we encourage you to read over our ETF Investing Guide for how to consider ETFs in your portfolio framework and all things ETF related.
What Is EEM? The iShares MSCI Emerging Markets ETF Explained
| Quick Answer
EEM is the iShares MSCI Emerging Markets ETF, managed by BlackRock and tracking the MSCI Emerging Markets Index — approximately 800-1,000 large and mid-cap stocks across 24+ developing economies including China, India, Taiwan, South Korea, and Brazil. Launched in 2003, it is one of the oldest, highest-AUM, and most liquid broad emerging markets ETFs in the world. |
When BlackRock launched EEM in April 2003, it was a genuinely innovative instrument: the first accessible ETF giving retail investors a single-ticker route to broad emerging market equity exposure. At the time, 0.68% was a competitive expense ratio. Two decades later, the fund management industry has driven costs to a fraction of that level — but EEM’s fee structure has barely moved.
What MSCI Defines as ‘Emerging Markets’
MSCI’s Emerging Markets classification covers countries with developing economies and growing capital markets that do not yet meet the developed market criteria — including factors like market accessibility, openness to foreign ownership, efficiency of operational frameworks, and stability of institutional frameworks. The 24+ countries in the MSCI Emerging Markets Index represent a wide range of economic development, from China’s $18 trillion economy to smaller frontier-adjacent markets.
EEM’s Position in the ETF Market
Two facts define EEM’s market position: first, it holds approximately $20B+ in assets under management — one of the largest non-U.S. equity ETFs by AUM. Second, its average daily trading volume and options market depth are unmatched among emerging market ETFs. EEM options trade across dozens of strikes and expirations with tight bid-ask spreads — a capability no competing EM ETF approaches.
This liquidity advantage is the reason EEM persists despite its cost disadvantage. For active traders, portfolio managers hedging EM exposure, and institutions executing large-volume trades, EEM’s tradability is worth paying for. For buy-and-hold investors, the calculus is very different.
What EEM Actually Owns: Country and Sector Breakdown
| Data Note
All country allocations and holdings are approximate and subject to change with quarterly rebalancing. Verify current composition at iShares.com before investing. |
Country Allocation
EEM’s country distribution reflects the MSCI Emerging Markets Index — dominated by China, India, and Taiwan, with meaningful allocations across Asia, Latin America, the Middle East, and Africa.
| Country | Approx. Weight | Key Exposure |
|---|---|---|
| China | ~25–30% | Tech (Alibaba, Tencent), Financials, Consumer |
| India | ~20–22% | IT services, Financials, Consumer Discretionary |
| Taiwan | ~15–18% | Semiconductors (TSMC dominates) |
| South Korea | ~10–12% | Semiconductors (Samsung), Financials |
| Brazil | ~5–7% | Commodities, Financials, Energy |
| Saudi Arabia | ~3–4% | Energy sector |
| Mexico | ~2–3% | Financials, Consumer Staples |
| Other 17+ Countries | ~10–15% | Indonesia, S. Africa, Thailand, UAE, etc. |
The China + Taiwan observation: combined, these two countries represent approximately 40-48% of EEM — creating a unique geopolitical concentration. Cross-strait tensions between China and Taiwan affect both allocations simultaneously. EEM investors are therefore not simply taking a diversified emerging markets bet — they are making a meaningful geopolitical bet on the stability of the world’s most strategically sensitive trade relationship.
Top Holdings (Illustrative — Verify at iShares.com)
| Company | Country | Sector | Approx. Weight |
|---|---|---|---|
| Taiwan Semiconductor (TSMC) | Taiwan | Technology | ~6–7% |
| Samsung Electronics | South Korea | Technology | ~3–4% |
| Alibaba Group | China | Consumer Discretionary | ~2–3% |
| Tencent Holdings | China | Communication Services | ~2–3% |
| Reliance Industries | India | Energy / Conglomerate | ~1–2% |
| Infosys | India | Technology (IT Services) | ~1–2% |
| HDFC Bank | India | Financials | ~1–2% |
| Meituan | China | Consumer Discretionary | ~0.5–1% |
Holdings and weightings change with quarterly index rebalancing. Verify current composition at iShares.com.
Sector Breakdown
Technology dominates EEM’s sector profile — driven primarily by TSMC, Samsung, and the Chinese internet sector. Financials is the second-largest sector, reflecting the significant banking and insurance exposure across India, China, South Korea, and Brazil. Consumer Discretionary (heavily weighted to Chinese e-commerce) rounds out the top three.
EEM vs IEMG vs VWO: The Cost Comparison That Changes Everything
| The Central Question
EEM charges 0.68% annually. iShares’ own IEMG charges 0.09%. Vanguard’s VWO charges 0.08%. For a passive investor, this fee gap — 0.59-0.60% per year — compounding over 20-30 years represents a very substantial reduction in ending portfolio value. The three funds are not identical, but they are far more similar than their fee structures suggest. |
The comparison below covers the three primary broad emerging markets ETF options that most investors will encounter:
| Feature | EEM | IEMG | VWO |
|---|---|---|---|
| Issuer | BlackRock (iShares) | BlackRock (iShares) | Vanguard |
| Expense Ratio | ~0.68% | ~0.09% | ~0.08% |
| Index Tracked | MSCI EM (Large/Mid) | MSCI EM IMI (L/M/S) | FTSE Emerging Markets |
| Holdings Count | ~800–1,000 | ~2,800 | ~1,000+ |
| AUM (Approx.) | ~$20B+ (verify) | ~$75B+ (verify) | ~$100B+ (verify) |
| Includes South Korea | Yes (MSCI = EM) | Yes (MSCI = EM) | No (FTSE = Developed) |
| Includes Small-Cap | No | Yes | No |
| Options Market | Deep / Liquid | Thin / Limited | Very Thin |
| Best Use Case | Active traders, institutions | Passive long-term investors | Passive, no South Korea pref. |
The 30-Year Cost Reality
The fee gap between EEM (0.68%) and IEMG (0.09%) is 0.59% per year. On a $100,000 investment growing at 7% annually before fees, the 30-year ending balance difference is approximately:
| Fund | Expense Ratio | Approx. 30-Yr Balance | Fees vs IEMG |
|---|---|---|---|
| IEMG | 0.09% | ~$742,000 | Baseline |
| VWO | 0.08% | ~$744,000 | Baseline |
| EEM | 0.68% | ~$570,000 | ~$170,000 less |
Assumes $100,000 initial investment, 7% gross annual return, 30-year horizon. Illustrative only — verify with a compound return calculator.
The South Korea distinction: EEM and IEMG include South Korea as an emerging market (Samsung, SK Hynix, Korea’s large financial sector) because MSCI classifies it as such. VWO excludes South Korea because FTSE classifies it as a developed market. For investors who want Samsung and South Korean semiconductor exposure in their EM allocation, IEMG is the relevant low-cost alternative to EEM — not VWO.
Why EEM Still Exists — The Liquidity Answer
If IEMG is so much cheaper and holds more securities, why does EEM still attract $20B+ in assets? The answer is options market depth. EEM has one of the deepest, most liquid options markets of any international ETF — across dozens of strikes and multiple expirations. For traders hedging equity portfolios, expressing tactical EM views through options, or implementing complex multi-leg strategies, EEM’s options liquidity has no substitute. IEMG’s options market is thin by comparison.
The China Question: EEM’s Biggest Concentration Risk and the Ex-China Alternative
Of all the analytical dimensions of EEM, China concentration is the most consequential and the least adequately covered in standard ETF data portal content.
Why China’s ~25-30% Weight Matters
China’s approximate 25-30% allocation makes it the largest single-country bet in EEM by a significant margin. In a truly diversified 24-country emerging markets fund, no single country would logically represent 25-30% of the portfolio. China’s outsize weight is a function of its market capitalisation — as the world’s second-largest economy, Chinese equities dominate the EM investable universe as MSCI defines it.
The practical implication: EEM’s performance is more sensitive to what happens in China than to any other single factor. A Chinese regulatory crackdown, a property market crisis, or a deterioration in U.S.-China relations will affect EEM’s China holdings directly — and may simultaneously affect the Taiwan allocation if cross-strait tensions are the driver.
The 2020-2021 Regulatory Crackdown: A Live Risk Example
Between 2020 and 2022, the Chinese government implemented a sweeping regulatory crackdown on technology and internet companies. Alibaba lost more than 70% of its market value from its 2020 peak. Didi Global’s U.S. IPO was reversed within days at Chinese government instruction. The education sector was effectively nationalised. Tencent and other gaming companies faced restrictions on gaming hours for minors.
These policy actions were entirely unpredictable from conventional financial analysis. They reflected a political priority — reducing the influence of private technology companies and reasserting state control over the domestic economy — that standard investment frameworks did not and could not anticipate. EEM investors absorbed these losses in proportion to their China allocation.
ADR Delisting Risk: The Ongoing Regulatory Overhang
Many Chinese companies are listed on U.S. exchanges as American Depositary Receipts (ADRs). The Holding Foreign Companies Accountable Act (HFCAA), passed in 2020, requires foreign companies listed on U.S. exchanges to permit PCAOB inspection of their audit work papers — or face delisting. Chinese companies have historically resisted this transparency.
While many Chinese companies have resolved this risk through dual listings in Hong Kong, the underlying tension between Chinese secrecy requirements and U.S. disclosure standards remains a structural overhang for Chinese ADR holders. EEM investors should monitor this issue as an ongoing regulatory risk.
EMXC: Emerging Markets Without China
For investors who want broad emerging market growth without China’s regulatory, geopolitical, and accounting risks, iShares offers EMXC — the iShares MSCI EM ex-China ETF. EMXC tracks the MSCI EM ex China index, providing exposure to 23+ emerging market countries — India, Taiwan, South Korea, Brazil, Saudi Arabia, and others — while completely excluding all Chinese securities.
EMXC charges approximately 0.25% — more than IEMG but far less than EEM, and with a materially different risk profile that many investors in 2024-2025 have found more appropriate given China’s domestic policy environment. Verify current expense ratio at iShares.com.
Risks Every EEM Investor Must Understand
Beyond standard equity market risk, EEM carries four specific risk categories that distinguish it from developed market equity ETFs.
1. Geopolitical Concentration Risk
With China at approximately 25-30% and Taiwan at approximately 15-18%, EEM allocates roughly 40-48% of its portfolio to the two countries most directly implicated in one of the world’s highest-stakes geopolitical tensions. The Taiwan Strait situation creates a scenario where a single geopolitical development could simultaneously affect nearly half the fund’s value. This is a concentration risk that has no equivalent in SPY, QQQ, or other major equity ETFs.
2. Currency Risk Across 24+ Markets
EEM’s dollar-denominated returns are affected by the exchange rate movements of 24+ emerging market currencies against the U.S. dollar. The Indian rupee, Chinese yuan, South Korean won, Brazilian real, South African rand, and others all fluctuate against the dollar — and a strong dollar environment systematically reduces the USD return from EM positions even when local-currency performance is positive.
Unlike some developed market ETFs where currency-hedged equivalents are readily available, broad emerging market currency hedging is rare and expensive — most EEM investors accept full currency exposure as part of the EM investment package.
3. Governance and Accounting Risk
Emerging market companies — particularly those in China — often operate under weaker shareholder protection frameworks, less transparent accounting standards, and higher levels of state ownership than their developed market counterparts. Chinese state-owned enterprises that appear in EEM’s holdings may prioritise policy objectives over shareholder returns. Variable interest entity (VIE) structures used by many Chinese companies to facilitate foreign investment create additional legal uncertainty about the ownership rights of foreign investors.
4. Historical Drawdown Severity
Emerging markets equities are structurally more volatile than developed market equities. EEM has experienced drawdowns of 40-60%+ during severe EM bear markets: the 2008 global financial crisis, the 2013 ‘taper tantrum,’ the 2015 Chinese yuan devaluation episode, and the 2022 Chinese regulatory and COVID-era sell-off. Investors considering EEM should be comfortable with drawdowns of this magnitude before entering a position.
How EEM Fits Into a Complete Portfolio
| The Verdict by Investor Profile
Active traders and institutions: EEM is the only practical choice — liquidity and options depth are unmatched. Passive long-term investors: IEMG or VWO deliver essentially the same EM exposure at 87-88% lower annual cost. The cost case for EEM in a buy-and-hold portfolio is very weak without a specific reason to prioritize options access. |
Profile 1: Passive Long-Term Investor
For an investor building a diversified international allocation with a 10-30 year time horizon, IEMG is the rational choice over EEM for any capital that will not be actively traded. The 30-year compounding mathematics produce approximately $170,000 in additional ending value on a $100,000 position at identical gross returns — from a 0.59% annual cost difference alone.
VWO is an equally valid low-cost alternative if the investor prefers Vanguard’s fund family or is comfortable excluding South Korea (Samsung, SK Hynix, Korean banks) from their EM allocation.
Profile 2: Active Trader
EEM is the dominant EM trading instrument for good reason. Daily volume exceeding $1B, options market liquidity across dozens of strikes and multiple expirations, tight bid-ask spreads at scale, and intraday price discovery make EEM the preferred vehicle for any trader needing to express a tactical view on emerging markets — whether directionally long, short, or through options strategies.
For active traders, the 0.68% annual expense ratio on a position held for days to weeks is largely irrelevant — the execution quality and options access are what matter.
Profile 3: Core-Satellite Portfolio Builder
For investors building a diversified international portfolio with separate developed and emerging market allocations, a 5-15% EM sleeve is a common approach. Within that sleeve, the China concentration question deserves explicit consideration: rather than accepting EEM’s passive ~28% China weighting, some investors are choosing a split allocation — EMXC for the majority of the EM sleeve, with a separate, deliberate China allocation at a reduced weight.
This approach allows the investor to capture India, Taiwan, Korea, Brazil, and the broader EM growth story while exercising explicit judgment about the size of their China bet — rather than accepting it passively.
Know What You Own Before You Buy
EEM is a legitimate, important ETF — but it is not the right choice for every investor who wants emerging market exposure.
The decision framework:
- Active trader / institution needing EM liquidity and options access → EEM is the correct choice
- Passive long-term investor wanting broad EM exposure → IEMG (0.09%) or VWO (0.08%) deliver near-identical results at 87-88% lower cost
- Investor wanting EM exposure without China overweight → EMXC provides 23+ country EM access at 0.25% with no China allocation
- Any investor → monitor China regulatory and geopolitical developments actively; the ~28% China allocation makes EEM uniquely sensitive to Beijing policy shifts
Emerging markets offer genuine long-term return potential from faster economic growth, demographic tailwinds, and expanding middle-class consumption. Capturing that potential intelligently means choosing the right vehicle — and for most investors who won’t be actively trading options on the position, the right vehicle is not EEM.
| Build Your Complete ETF Portfolio With ATGL
At AboveTheGreenLine.com we give investors the analytical framework to evaluate every ETF — from the cost comparison that most investors miss to the geopolitical risks embedded in country allocations. If you want a complete, rules-based system for building and managing your ETF portfolio, join us Above the Green Line. |
Frequently Asked Questions
What countries does EEM invest in?
EEM invests across 24+ emerging market countries. The top five by approximate weighting are China (~25-30%), India (~20-22%), Taiwan (~15-18%), South Korea (~10-12%), and Brazil (~5-7%). China and Taiwan together represent approximately 40-48% of the fund, creating meaningful geopolitical concentration from cross-strait tensions and China regulatory risk. Verify current allocations at iShares.com — these change with quarterly rebalancing.
What is the expense ratio of EEM?
EEM charges an expense ratio of approximately 0.68% annually — significantly higher than its primary competitors. iShares’ own IEMG, which tracks a nearly identical (and broader) MSCI Emerging Markets index, charges approximately 0.09%. Vanguard’s VWO charges approximately 0.08%. For a long-term passive investor, this 0.59% cost gap compounding over 30 years can reduce ending portfolio value by approximately $170,000 on a $100,000 initial investment.
Is EEM the same as IEMG?
Similar but not identical. Both track MSCI Emerging Markets indices, but EEM tracks only large and mid-cap stocks (~800-1,000 holdings) while IEMG tracks the broader MSCI EM IMI index including small-cap stocks (~2,800 holdings). Both include South Korea. The critical practical difference: IEMG charges 0.09% versus EEM’s 0.68% — a 0.59% annual cost gap. For passive investors, IEMG is the more cost-efficient choice; for active traders requiring maximum options liquidity, EEM remains the dominant instrument.
Does EEM include China?
Yes. China is typically EEM’s largest single-country allocation at approximately 25-30% of the fund. This includes Chinese stocks listed on mainland exchanges (via Stock Connect), Hong Kong, and U.S.-listed ADRs of Chinese companies. Investors seeking emerging market exposure without China can consider EMXC (iShares MSCI EM ex-China ETF), which provides exposure to 23+ EM countries while excluding all Chinese securities. EMXC charges approximately 0.25% — verify at iShares.com.

Related Articles
[pt_view id=”fb2451fm3r”]