
By ATGL
Updated April 2, 2025
Technical analysis provides you with powerful tools to identify potential market movements through pattern recognition. Among these valuable trading patterns you should know, the triple bottom pattern stands out as a significant bullish reversal pattern. This pattern appears after a prolonged downtrend and signals a potential shift in market sentiment. Understanding how to identify and trade this pattern effectively can provide a strategic advantage in capturing profitable opportunities while minimizing potential losses.
What Is a Triple Bottom Pattern?
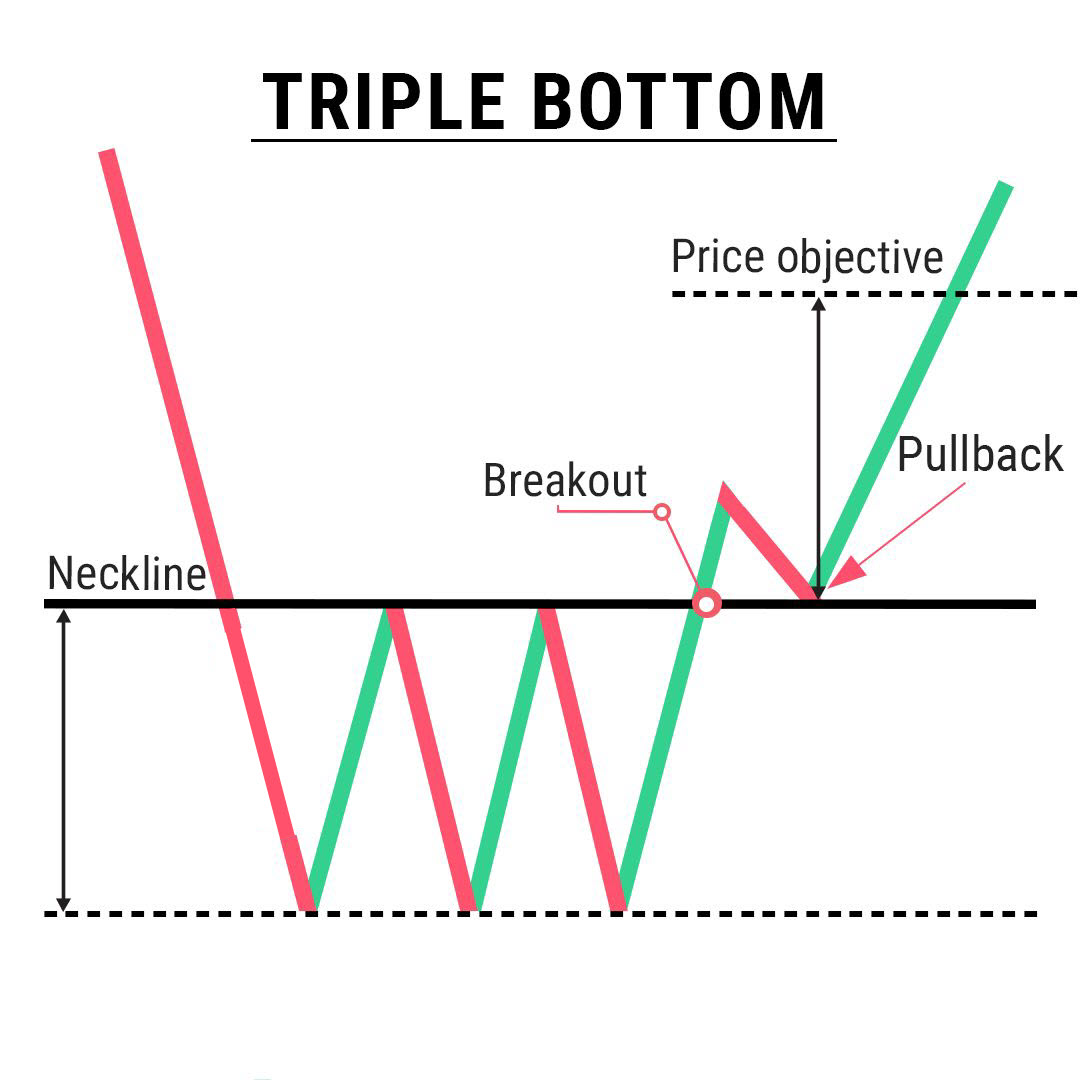
The triple bottom pattern is a bullish reversal pattern that forms after a prolonged downtrend, signaling potential trend reversals from bearish to bullish in the financial markets. As the name suggests, this pattern consists of three consecutive lows or “bottoms” that reach approximately the same price level, creating a horizontal support zone. The pattern demonstrates that sellers have attempted and failed three times to push prices below a critical resistance level, indicating weakening downward momentum and growing buyer interest.
Unlike the double bottom pattern, which only requires two tests of support, the triple bottom provides additional confirmation of support strength through its third test. This increased validation makes the triple bottom particularly noteworthy to technical analysts seeking high-probability trade setups. The completion of this pattern frequently precedes a substantial upward price movement as buyers gain dominance in the market.
Identifying the Triple Bottom Pattern
Recognizing a genuine triple bottom pattern requires attention to specific structural elements:
Three distinct lows: The pattern displays three troughs that reach approximately the same price level, typically within a 3% to 5% range of each other. These lows represent failed attempts by sellers to push prices lower.
Neckline resistance: A horizontal resistance level connects the peaks between the troughs. This neckline serves as a critical threshold; a decisive break above this level confirms the pattern.
Decreasing volume: Ideally, trading volume decreases during the formation of each successive bottom, indicating diminishing selling pressure. Volume should then increase significantly during the breakout above the neckline.
Time duration: Authentic triple bottoms develop over substantial time periods, typically several weeks to months. This extended duration contributes to the pattern’s reliability.
The triple bottom shares characteristics with other reversal patterns, like the head and shoulders pattern, but differs in its symmetrical structure. Unlike the rising wedge pattern, which forms during uptrends, the triple bottom specifically appears at the end of downtrends.
What Happens After Triple Bottom Pattern?
Trend reversal: Once the pattern is validated by a breakout above the neckline, the market sentiment shifts from bearish to bullish. This transition often leads to a sustained upward movement.
Price target projection: The measured move objective for the pattern equals the height of the formation (from support to neckline) added to the breakout point. This calculation provides you with reasonable profit targets.
Support conversion: The previous neckline resistance level frequently transforms into support when tested from above, offering potential entry opportunities on pullbacks.
Follow-through momentum: Successful breakouts generally demonstrate strong momentum, with prices advancing steadily after clearing the neckline. This momentum may accelerate as additional technical indicators confirm the reversal.
The triple bottom differs from continuation patterns like the bull flag pattern or bear pennant pattern, which signal temporary consolidations within existing trends rather than major potential trend reversals.
How To Trade a Triple Bottom Pattern
Optimal entry and exit points: The most reliable entry occurs after price breaks and closes above the neckline resistance on increased volume. Conservative traders may wait for a successful retest of the neckline as support before entering. Exit strategies should include a primary price target at the measured move objective, with partial position closing at significant resistance levels.
Using MACD for confirmation: The Moving Average Convergence Divergence (MACD) indicator offers valuable confirmation of the pattern’s validity. Bullish divergence between the MACD and price action during the formation of the third bottom strengthens the reversal signal. Additionally, a MACD line crossing above its signal line near the breakout point further validates the pattern.
Incorporating Fibonacci retracement: Fibonacci retracement levels help identify potential resistance zones during the subsequent uptrend. The 38.2%, 50%, and 61.8% retracement levels frequently align with natural pausing points in the price advance. These levels can serve as references for adding to positions or implementing trailing stops.
Like the triangle chart pattern and cup and handle pattern, proper risk management remains essential when trading the triple bottom. Setting stop-loss orders below the most recent bottom protects capital if the pattern fails.
Common Mistakes and Misinterpretations of a Triple Bottom Pattern
Entering positions prematurely: A common mistake involves initiating trades before pattern confirmation. True validation requires a decisive close above the neckline resistance. Premature entries often result in unnecessary potential losses during pattern formation.
Setting unrealistic profit targets: While triple bottoms can initiate substantial rallies, excessive profit expectations lead to missed opportunities. Adhering to the measured move calculation provides realistic objectives. Unlike the aggressive reversals seen with the bear flag pattern, triple bottom moves tend to be methodical rather than explosive.
Ignoring timeframe differences: Triple bottoms identified on lower timeframes generally prove less reliable than those on daily or weekly charts. Patterns that develop over extended periods demonstrate greater significance. Maintain awareness of the pattern’s context within multiple timeframes.
False signals: Market conditions can sometimes produce formations that resemble triple bottoms but lack the necessary validation criteria. These false signals often trap novice traders who fail to wait for proper confirmation before entering positions.
FAQs About Triple Bottom Pattern
Is a Triple Bottom Bullish or Bearish?
The triple bottom pattern is decidedly bullish, signaling potential trend reversals from a downtrend to an uptrend. After three unsuccessful attempts to breach support, buyers gain control and push prices higher.
What Is the Success Rate of the Triple Bottom Pattern?
Research indicates that properly formed triple bottom patterns have a success rate of approximately 75-80%. This reliability exceeds many other pattern types, though proper confirmation remains essential for optimal results.
What Is the Difference Between Double Bottom and Triple Bottom Patterns?
While both patterns signal bullish reversals, the triple bottom provides additional confirmation through its third test of support. This extra validation typically results in higher reliability but requires more time to develop compared to the double bottom formation.
Trade the Triple Bottom Pattern Effectively With Above the Green Line
Mastering the triple bottom pattern provides you with a key advantage in spotting high-probability reversal opportunities in various market conditions. Its clear structure makes it valuable in technical analysis. For best results, combine this pattern with other techniques, like the triple top pattern, to identify both bullish and bearish reversals.
Above the Green Line offers tools and resources to help you trade the triple bottom pattern effectively. Our analytical approach merges pattern recognition with advanced technical indicators to enhance your trading performance. Learn more about how we can help you leverage these powerful reversal signals.

Related Articles

Margin Call Explained: What Triggers It and How to Avoid One

AMC Short Squeeze Explained: Timeline, Causes, and Trading Risks

Volatility Clustering in Financial Markets: Understand Why It Happens

Chaikin Money Flow (CMF): How to Use Volume to Spot Real Market Strength
