By ATGL
Updated April 14, 2025
The cup and handle pattern is a well-known technical analysis formation that signals a potential bullish continuation in stocks and other tradable assets. By understanding how to identify and trade this pattern effectively, you can take advantage of potential breakouts and optimize your investment strategies.
What Is a Cup and Handle Pattern?
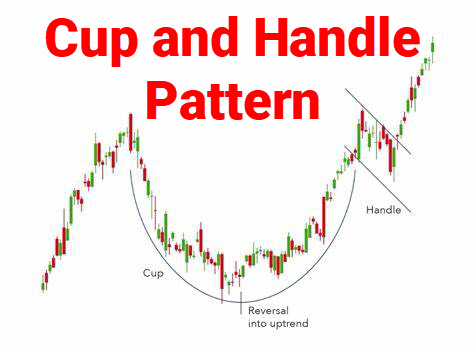
A cup and handle pattern is a bullish continuation pattern that forms during an upward trend and resembles the shape of a teacup when plotted on a price chart. It was introduced by William J. O’Neil in his book How to Make Money in Stocks and is widely used by traders to identify potential breakout opportunities.
Key Characteristics:
- Cup Formation: The cup should have a rounded bottom, which forms after a downward trend, followed by a gradual recovery.
- Handle Formation: A small consolidation phase (handle) follows the cup, often forming a slight downward drift.
- Breakout Point: The price breaks above the resistance level, confirming the pattern.
This pattern typically appears over weeks or months and is a strong technical indicator of potential upward momentum.
Cup and Handle Formation: Components To Identify
Cup Shape
The cup should have a rounded bottom, showing a gradual price decline and subsequent recovery. A U-shaped cup is preferred over a V-shape, as it indicates strong support and a healthy consolidation period. The depth of the cup should not be excessively deep, as a shallower cup generally signals stronger technical patterns.
Handle Formation
The handle should form on the right side of the cup as a brief pullback or sideways movement. It should be relatively small compared to the cup (typically retracing less than one-third of the cup’s height). A downward-sloping handle is normal, but excessive downward movement weakens the setup.
Volume
Declining volume during the cup formation suggests weak selling pressure. Increased volume on the breakout confirms strong buying interest.
Breakout
The breakout occurs when the price surpasses the handle’s resistance level, confirming the breakout level. A successful breakout is typically accompanied by high trading volume, providing a strong bullish signal and market conviction. Incorporating stock forecasting techniques can further enhance your ability to identify high-probability breakouts.
How To Trade on the Cup and Handle Pattern: Rules and Strategies
Once you have identified the cup and handle pattern, the next step is executing a profitable trade using key trading strategies.
1. Entry Strategy
- Enter after the breakout when the price moves above the handle’s resistance level.
- Look for confirmation with a strong volume surge, indicating market participation.
- Avoid premature entries before the breakout is confirmed.
2. Stop-Loss Placement
- Place a stop-loss order slightly below the handle’s low.
- “If the handle is too wide, adjust your stop-loss to a reasonable loss level that aligns with your risk tolerance.
- Using support levels as stop indicators can reduce unnecessary losses.
3. Profit Target
- The expected price move is often equal to the depth of the cup, added to the breakout point.
- Consider taking partial profits at key resistance levels.
- Use a trailing stop-loss to lock in gains while allowing further upside.
4. Additional Confirmation
- The bull flag pattern can sometimes follow a cup and handle breakout, signaling continued bullish strength. Learn to recognize both patterns for additional trading opportunities.
Common Mistakes in Trading the Cup and Handle Pattern
Trading During Loose Handles
A loose or wide handle indicates uncertainty, leading to a higher risk of a failed breakout. When price action within the handle is erratic, it suggests weak buyer conviction and potential false breakouts.
Solution: Wait for a tight handle formation with controlled movement near the upper portion of the cup. A well-structured handle reflects steady accumulation, reinforcing the breakout’s strength.
Trading from Weak Base Positions
A cup with an excessively deep base suggests instability and excessive prior selling pressure, making the breakout less reliable. The deeper the cup, the more volatile the price action, which can lead to weak follow-through after the breakout.
Solution: Favor shallower, well-formed bases—ideally, one-third to one-half of the preceding trend. This structure reflects stronger accumulation and increases the likelihood of a sustainable upward trend.
Ignoring Volume Confirmation
Breakouts occurring at low volume often lack conviction and increase the likelihood of false breakouts. Strong volume confirms institutional participation and validates the breakout.
Solution: Verify that volume surge accompanies the breakout, signaling strong buying interest. Additionally, consider broader market conditions to confirm bullish sentiment and improve trade reliability.
Ignoring Upward-Sloping Handles
An upward-sloping handle suggests premature buying pressure, weakening breakout momentum and increasing the risk of failure. A properly formed handle allows for a healthier consolidation before the breakout.
Solution: Look for sideways or slightly downward handles that consolidate price action. This structure helps shake out weak hands and strengthens the breakout potential.
Learn To Trade on the Cup and Handle Patterns With ATGL
At Above the Green Line, we provide expert guidance on recognizing and trading high-probability chart patterns like the cup and handle pattern. Our resources, including insights into stock forecasting, help traders make informed decisions in the market.
For exclusive trading insights and pattern breakdowns, explore our trading patterns section, where you’ll find in-depth analyses of setups like the bull flag pattern.
Sign up for an Above the Green Line membership and gain access to insights, strategic education, and market analysis to support your trading journey.
FAQs About the Cup and Handle Stock Pattern
Is the Cup and Handle Pattern Bullish?
Yes, it is a bullish continuation pattern, indicating a potential uptrend after a period of accumulation.
What Are the Rules for a Cup and Handle Pattern?
The key rules include:
- The cup should have a rounded bottom.
- The handle should be relatively small.
- Breakouts should occur above the handle’s resistance, supported by high volume.
What Is the Success Rate of the Cup and Handle Pattern?
The success rate varies, but studies suggest it has a high probability of breakout success, particularly when volume supports the move.
How Deep Should a Cup and Handle Pattern Be?
The ideal depth is typically one-third to one-half of the preceding trend. A very deep cup can indicate weakness in the setup.

Related Articles
[pt_view id=”9517038dwu”]