By Andrew Stowers
Updated April 28, 2026
Gold is making headlines again. And if you’ve been searching for the best way to profit, you’ve almost certainly come across GDX. But before you buy, there’s something most articles won’t tell you: GDX is not a gold trade. It’s a gold miners trade — and that distinction can cost you significantly if you don’t understand what you’re actually buying.
The VanEck Gold Miners ETF is one of the most actively traded gold-related securities in the world. It’s liquid, well-known, and offers genuine leverage to gold price moves. But it also carries risks, costs, and behavioral quirks that its ETF data-sheet doesn’t capture.
Building off of our ETF Investing Guide, this guide covers everything active traders and self-directed investors need to know about GDX: how it’s structured, why it moves differently than gold, how it compares to its key alternatives, what risks to manage, and — the part most articles skip entirely — how to trade it with a rules-based approach.
What Is GDX? Structure, Holdings, and How It Works
| Quick Answer
GDX is the VanEck Gold Miners ETF. It tracks the NYSE Arca Gold Miners Index and holds shares of publicly traded gold mining companies — not physical gold. GDX gives investors indirect exposure to gold prices through the equity performance of the companies that mine it. |
Launched in 2006 by VanEck, GDX was the first ETF specifically designed to track the performance of gold mining equities as a basket. Rather than holding gold bullion in a vault, GDX holds shares in approximately 50–60 publicly traded mining companies across the globe, weighted primarily by market capitalisation.
The fund tracks the NYSE Arca Gold Miners Index, a rules-based benchmark that includes companies generating at least 50% of their revenue from gold and silver mining. The index is reviewed and rebalanced quarterly.
As a sector ETF, GDX sits alongside other resource-focused funds that give equity exposure to a commodity-driven industry. The key structural distinction that every trader must internalise: owning GDX is not the same as owning gold.
GDX Key Facts
| Field | Detail |
|---|---|
| Issuer | VanEck |
| Full Name | VanEck Gold Miners ETF |
| Ticker | GDX (NYSE Arca) |
| Index Tracked | NYSE Arca Gold Miners Index |
| Inception Date | May 2006 |
| Number of Holdings | ~50–60 companies |
| Expense Ratio | ~0.51% annually (verify at VanEck.com) |
| AUM | ~$13B+ (verify current figure at VanEck.com) |
| Dividend | Paid annually; typically <2% yield |
GDX Top Holdings (Approximate — Verify at VanEck.com)
| Company | Country | Approx. Weight |
|---|---|---|
| Newmont Corporation | USA / Global | ~12–14% |
| Barrick Gold Corporation | Canada / Global | ~8–10% |
| Agnico Eagle Mines | Canada | ~7–9% |
| Wheaton Precious Metals | Canada | ~5–7% |
| Gold Fields Limited | South Africa | ~4–5% |
| AngloGold Ashanti | South Africa | ~4–5% |
| Kinross Gold Corporation | Canada | ~3–4% |
| Pan American Silver | Canada | ~2–3% |
Note: holdings and weightings change with quarterly index rebalancing. Always verify current composition at VanEck.com before making trading or investment decisions.
Why GDX Moves Differently Than Gold
| Key Insight
GDX tends to amplify gold’s price moves in both directions. When gold rises 10%, GDX may rise 20–30%. When gold falls 10%, GDX often falls 20–30% or more. This amplification is not a coincidence — it’s the direct result of operating leverage built into the economics of gold mining. |
Operating Leverage: The Engine Behind GDX’s Amplification
Gold mining is a business with largely fixed operating costs. Drilling, blasting, processing, labor, energy — these costs don’t move proportionally with the gold price. When gold rises from $1,800 to $2,000 an ounce (an 11% move), a miner with a $1,600 all-in sustaining cost (AISC) sees its profit margin expand from $200 to $400 per ounce — a 100% increase in profitability on an 11% move in gold.
The reverse is equally powerful and equally dangerous. A drop from $2,000 to $1,700 doesn’t just reduce the miner’s revenue — it can compress margins from $400 to $100 per ounce, an instant 75% margin collapse. This is why GDX can fall far harder than gold in a downturn.
Other Factors That Create Divergence from Gold
Beyond operating leverage, several additional factors cause GDX to diverge from gold price movements:
- All-in sustaining costs (AISC): The breakeven threshold varies widely by company and mine. When gold trades near or below AISC, miners face existential pressure.
- Currency risk: Many GDX holdings operate in Australia, South Africa, and Canada. A strengthening USD can compress margins in local-currency terms even when dollar-denominated gold is flat.
- Energy costs: Mining is energy-intensive. Oil price spikes directly compress miner margins regardless of gold’s direction.
- Company-specific risk: Mine accidents, regulatory changes, labour disputes, and management decisions all affect individual holdings — and therefore GDX.
- Historical beta: GDX has historically carried a beta of 1.5–2.5x relative to gold prices, though this varies significantly with market conditions.
Understanding these dynamics is what separates a trader who uses GDX effectively from one who buys it expecting it to simply track gold.
GDX Key Facts and Fund Structure
Beyond the holdings list, a few structural details are worth understanding before trading GDX.
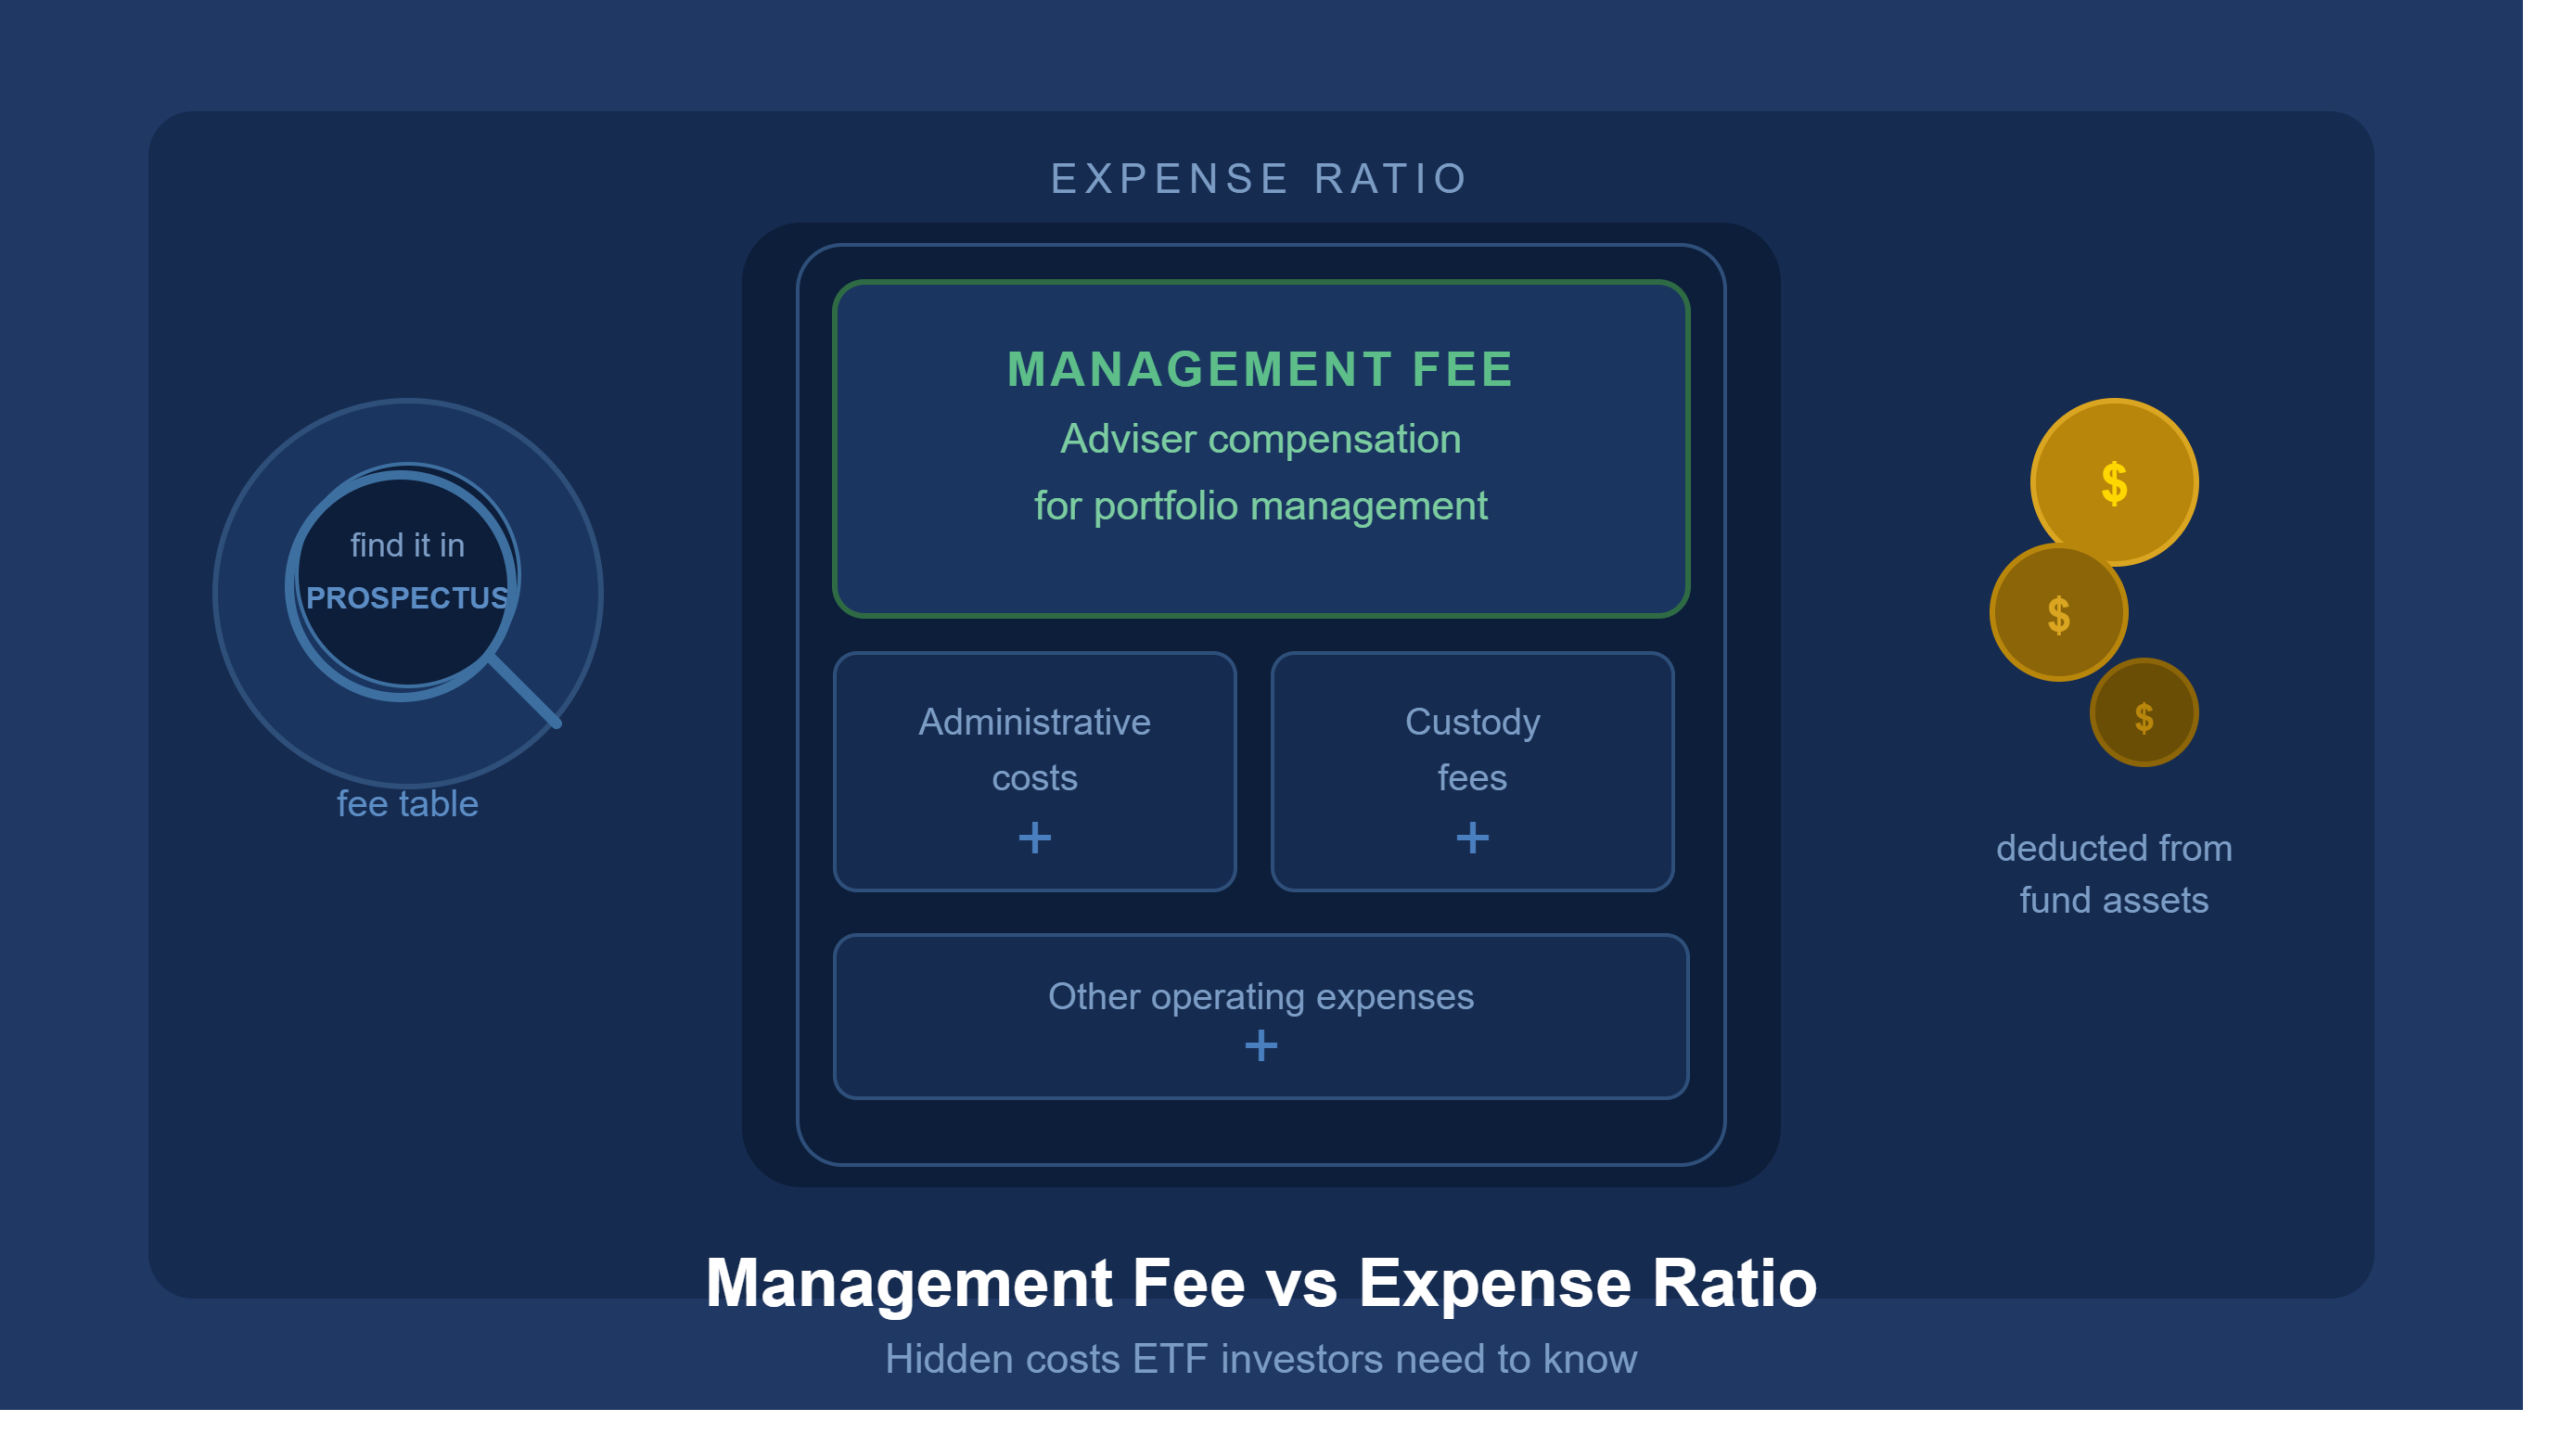
Expense Ratio
At approximately 0.51% annually, GDX’s expense ratio is higher than physical gold ETFs like GLD (approximately 0.40%) and IAU (approximately 0.25%). For long-term buy-and-hold investors this cost difference is meaningful. For active traders holding GDX for days to weeks, it is largely irrelevant — but it matters in direct comparisons with alternatives.
Liquidity
GDX is one of the most liquid ETFs in the commodity-equity space, typically trading hundreds of millions of dollars in daily volume. For active traders, this means tight bid-ask spreads and minimal slippage on entries and exits — a significant advantage over individual mining stocks.
Dividends
GDX does pay dividends, though the yield is modest and variable — typically under 2% annually — reflecting the mixed dividend policies of the underlying mining companies. GDX is not an income vehicle. It is held for capital appreciation driven by gold price movements and mining equity valuations.
Tax Treatment
As an equity ETF registered under the Investment Company Act of 1940, GDX is generally taxed at standard capital gains rates — favourably compared to physical gold ETFs (GLD, IAU) which may be taxed as collectibles at a higher rate. Consult a tax professional for guidance specific to your situation.
GDX vs GLD vs IAU vs GDXJ: Which Gold ETF Is Right for You?
| Quick Answer
GDX holds gold mining stocks and amplifies gold price moves. GLD and IAU hold physical gold and track spot prices directly. GDXJ holds smaller junior miners with even higher volatility than GDX. The right choice depends on your risk tolerance, time horizon, and whether you want direct or leveraged gold exposure. |
The gold ETF space offers four main vehicles, each with a fundamentally different risk/reward profile. Here’s how they compare directly:
| Feature | GDX | GLD | IAU | GDXJ |
|---|---|---|---|---|
| Exposure Type | Gold mining equities | Physical gold | Physical gold | Junior mining equities |
| Expense Ratio | ~0.51% | ~0.40% | ~0.25% | ~0.52% |
| Beta to Gold | ~1.5–2.5x | ~1.0x | ~1.0x | ~2.0–3.5x |
| Volatility Profile | High | Moderate | Moderate | Very High |
| Dividend | Yes (<2%) | No | No | Yes (<2%) |
| Tax Treatment | Equity CGT rates | Collectible rates* | Collectible rates* | Equity CGT rates |
| Best Use Case | Swing trading gold bull markets | Pure gold price tracking | Long-term gold allocation | Aggressive gold leverage |
*Tax treatment of physical gold ETFs may vary by jurisdiction and holding period — consult a tax professional.
The verdict for active traders: GDX offers the best combination of liquidity, leverage, and tradability for swing traders with gold conviction. For long-term investors building a gold allocation, IAU’s lower expense ratio and direct bullion exposure make it a more cost-efficient vehicle. For those who want maximum leverage and can tolerate extreme volatility, GDXJ is the most aggressive option.
For a deeper comparison of the physical gold ETF options, see the full GLD vs IAU breakdown at ATGL.
The Risks of GDX Every Trader Must Understand
GDX is a powerful instrument — but it carries risks that physical gold ETFs do not. Every trader should understand these clearly before sizing a position.
- Amplified downside: GDX falls harder than gold in bear markets. The same operating leverage that creates 2x+ upside in gold bull markets creates 2x+ downside in gold bear markets. Never treat GDX as a ‘safe haven’ trade — it is not.
- Correlation breakdown: GDX does not always track gold. Mining-specific headwinds — rising energy costs, operational disruptions, a strong U.S. dollar compressing local-currency margins — can cause GDX to underperform or even move opposite to gold for extended periods.
- Concentration risk: The top 10 holdings typically represent over 50% of the fund. A major operational problem at Newmont or Barrick (the two largest holdings) can move GDX meaningfully even if gold itself is unchanged.
- Currency risk: Most of the top holdings operate in non-USD currencies (AUD, ZAR, CAD). A strong U.S. dollar can compress miner profitability and suppress GDX even when gold is rising in dollar terms.
- Energy and input cost risk: Gold mining is energy-intensive. When oil prices spike, miner operating costs rise, margins compress, and GDX can lag gold’s performance significantly.
- Geopolitical and regulatory risk: Several major GDX holdings operate in politically complex jurisdictions. Mine nationalisation, permit cancellations, and environmental regulatory changes are tail risks that physical gold ETFs simply do not carry.
How to Trade GDX: A Rules-Based Approach
Most articles about GDX stop at the data. This section covers what active traders actually need to know: how to use GDX systematically with a defined entry framework, proper position sizing, and clear risk management rules.
Step 1: Use Gold as the Macro Filter
Before considering any GDX entry, check the gold price trend first. GDX is a gold amplifier — trading it against the direction of gold is fighting the dominant force driving the fund. The framework is simple:
- Gold above its 50-day and 200-day moving averages and in an uptrend → GDX long setups are valid
- Gold in a downtrend or below key moving averages → GDX long setups carry significantly higher failure rates
- Gold in a consolidation range → GDX may be appropriate for range-bound swing trades but requires tighter risk management
This macro filter alone eliminates the most common GDX mistake: buying the miners ETF while gold is in a downtrend because ‘it looks cheap.’
Step 2: Identify Technical Setups on the GDX Chart
Once the gold macro filter is clear, look for one of three technical setups on the GDX daily chart:
- Breakout from a consolidation base: GDX forms a tight range for 2–4 weeks, then breaks out on above-average volume. Enter on the breakout with a stop below the consolidation low.
- Pullback to a rising moving average: After a strong initial move, GDX pulls back to the 20-day or 50-day MA with declining volume, then resumes the uptrend. Enter on the first day of confirmed resumption.
- Volume-confirmed reversal at key support: After a decline, GDX finds support at a prior swing low or key level with a reversal candle on elevated volume. Enter with a stop below the support level.
Step 3: Size Positions for GDX’s Higher Beta
Because GDX carries a beta of 1.5–2.5x relative to gold, you should reduce your position size relative to what you would take on a lower-volatility ETF like GLD or IAU. A practical rule: if you would normally allocate 5% of your portfolio to a GLD position, consider 2–3% for an equivalent GDX trade to keep dollar risk similar.
Step 4: Know Your Catalysts
GDX reacts sharply to specific macro events. Build these into your trading calendar:
- Fed rate decisions and FOMC meeting minutes — rate expectations drive gold, which drives GDX
- U.S. dollar index (DXY) direction — a weakening dollar is generally bullish for gold and GDX
- Major miner earnings — particularly Newmont and Barrick, which together represent ~20%+ of GDX
- Geopolitical risk events — gold’s safe-haven demand can spike on geopolitical developments
| ATGL Framework Summary
Macro filter: gold in uptrend → GDX long setups valid |
The Verdict: Is GDX the Best Way to Profit From Gold Right Now?
GDX is a genuinely powerful tool for active traders with gold conviction. It offers institutional-grade liquidity, real leverage to gold price moves, and a diversified basket of the world’s largest miners — packaged in an easy-to-trade ETF.
But it is not the right vehicle for every investor. For long-term buy-and-hold gold allocation, IAU’s lower expense ratio and direct bullion exposure make it a more cost-efficient choice. For traders who want maximum leverage and can tolerate extreme swings, GDXJ takes it further. And for those who simply want to track gold without the added noise of mining company risk, GLD or IAU are cleaner instruments.
GDX is the right choice when: you have a clear gold uptrend as a macro tailwind, you have identified a rules-based technical entry, you have sized the position appropriately for its higher beta, and you have a defined stop and exit plan before you enter.
That’s the difference between using GDX as a precision instrument and using it as a hope trade. ATGL’s system is built to help you do the former.
| Ready to Trade GDX With a Complete System?
At AboveTheGreenLine.com we teach a systematic approach to swing trading ETFs and equities — clear setups, defined risk, and disciplined execution across every instrument. If you want the full rules-based framework for trading GDX and the broader gold complex, join us Above the Green Line and get access to our complete trading system, real-time alerts, and a community of process-driven traders. |
Frequently Asked Questions
Is GDX the same as gold?
No. GDX holds shares of gold mining companies, not physical gold. This means GDX amplifies gold price moves — rising more than gold in bull markets and falling harder in downturns — because mining stocks carry operating leverage, currency risk, and company-specific risk that physical gold does not.
What is the expense ratio of GDX?
GDX charges an expense ratio of approximately 0.51% annually. This is higher than physical gold ETFs like GLD (~0.40%) and IAU (~0.25%) but is typical for equity-based sector ETFs that require active index management and quarterly rebalancing of mining company positions.
What is the difference between GDX and GDXJ?
GDX holds large-cap senior gold mining companies like Newmont and Barrick Gold. GDXJ — the VanEck Junior Gold Miners ETF — holds smaller, junior mining companies. GDXJ typically offers higher potential returns in gold bull markets but carries significantly greater volatility and company-specific risk than GDX.
Does GDX pay dividends?
Yes, GDX pays dividends, though the yield is modest and variable — typically under 2% annually — reflecting the mixed dividend policies of the underlying mining companies. GDX is primarily a capital appreciation vehicle, not an income instrument.

Related Articles
ETF =======> [pt_view id=”fb2451fm3r”]