By ATGL
Updated April 19, 2024
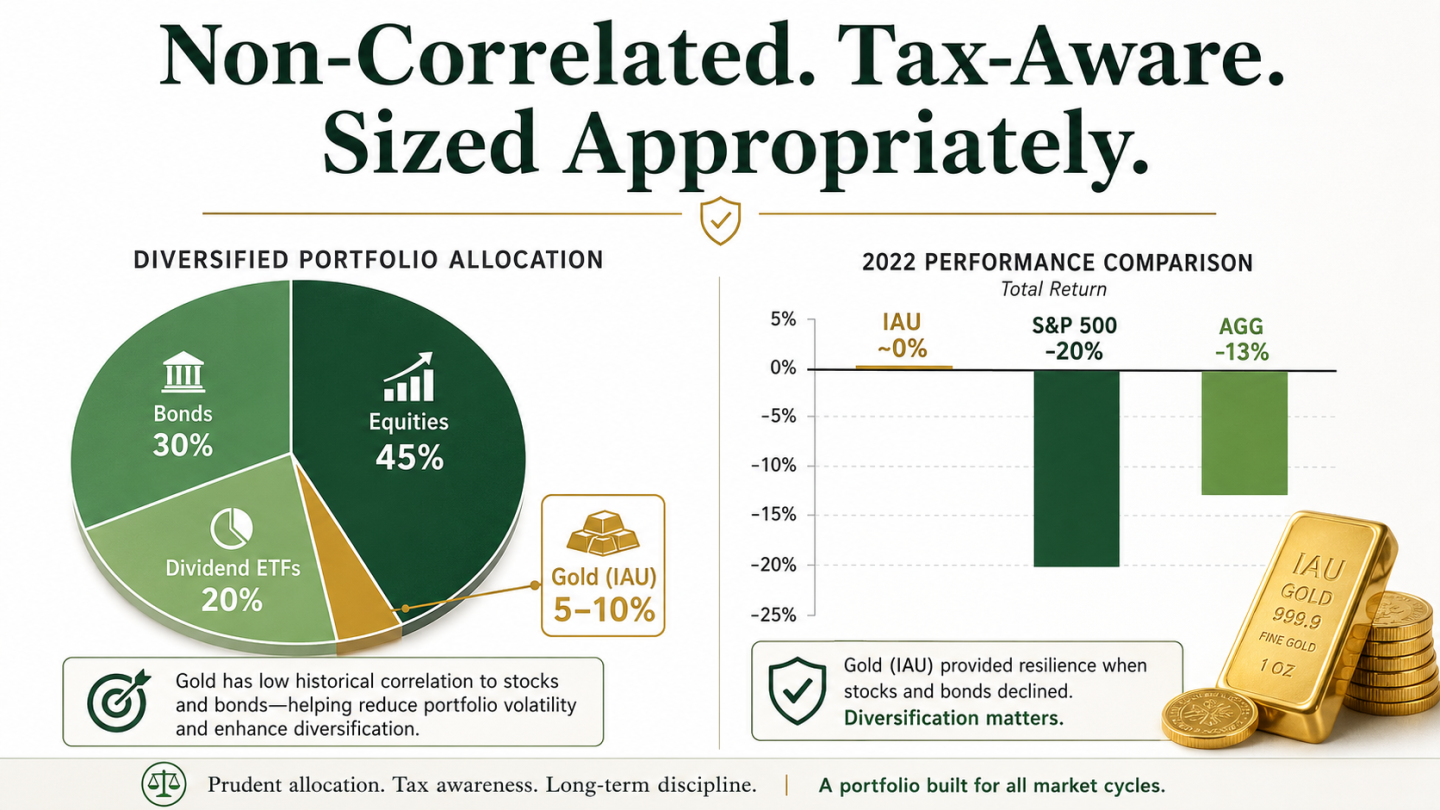
Gold has been a cornerstone of investment portfolios for centuries, offering a hedge against inflation and a safe haven in times of market volatility. Investors looking to incorporate gold into their portfolios typically turn to gold-backed exchange-traded funds (ETFs), which provide ease of trading and exposure to the metal’s price movements. Two of the most prominent gold ETFs are the SPDR Gold Trust (GLD) and the iShares Gold Trust (IAU).
While both GLD and IAU aim to track the price of gold, they differ significantly in their approach and the benefits they offer to investors. Understanding these differences is crucial as they can impact the investment’s overall cost, performance, and suitability according to individual investment strategies. This post delves into a thorough comparison between GLD and IAU, examining their structure, expense ratios, liquidity, and overall performance to guide investors in choosing the ETF that best aligns with their financial goals.
Is IAU Better Than GLD?
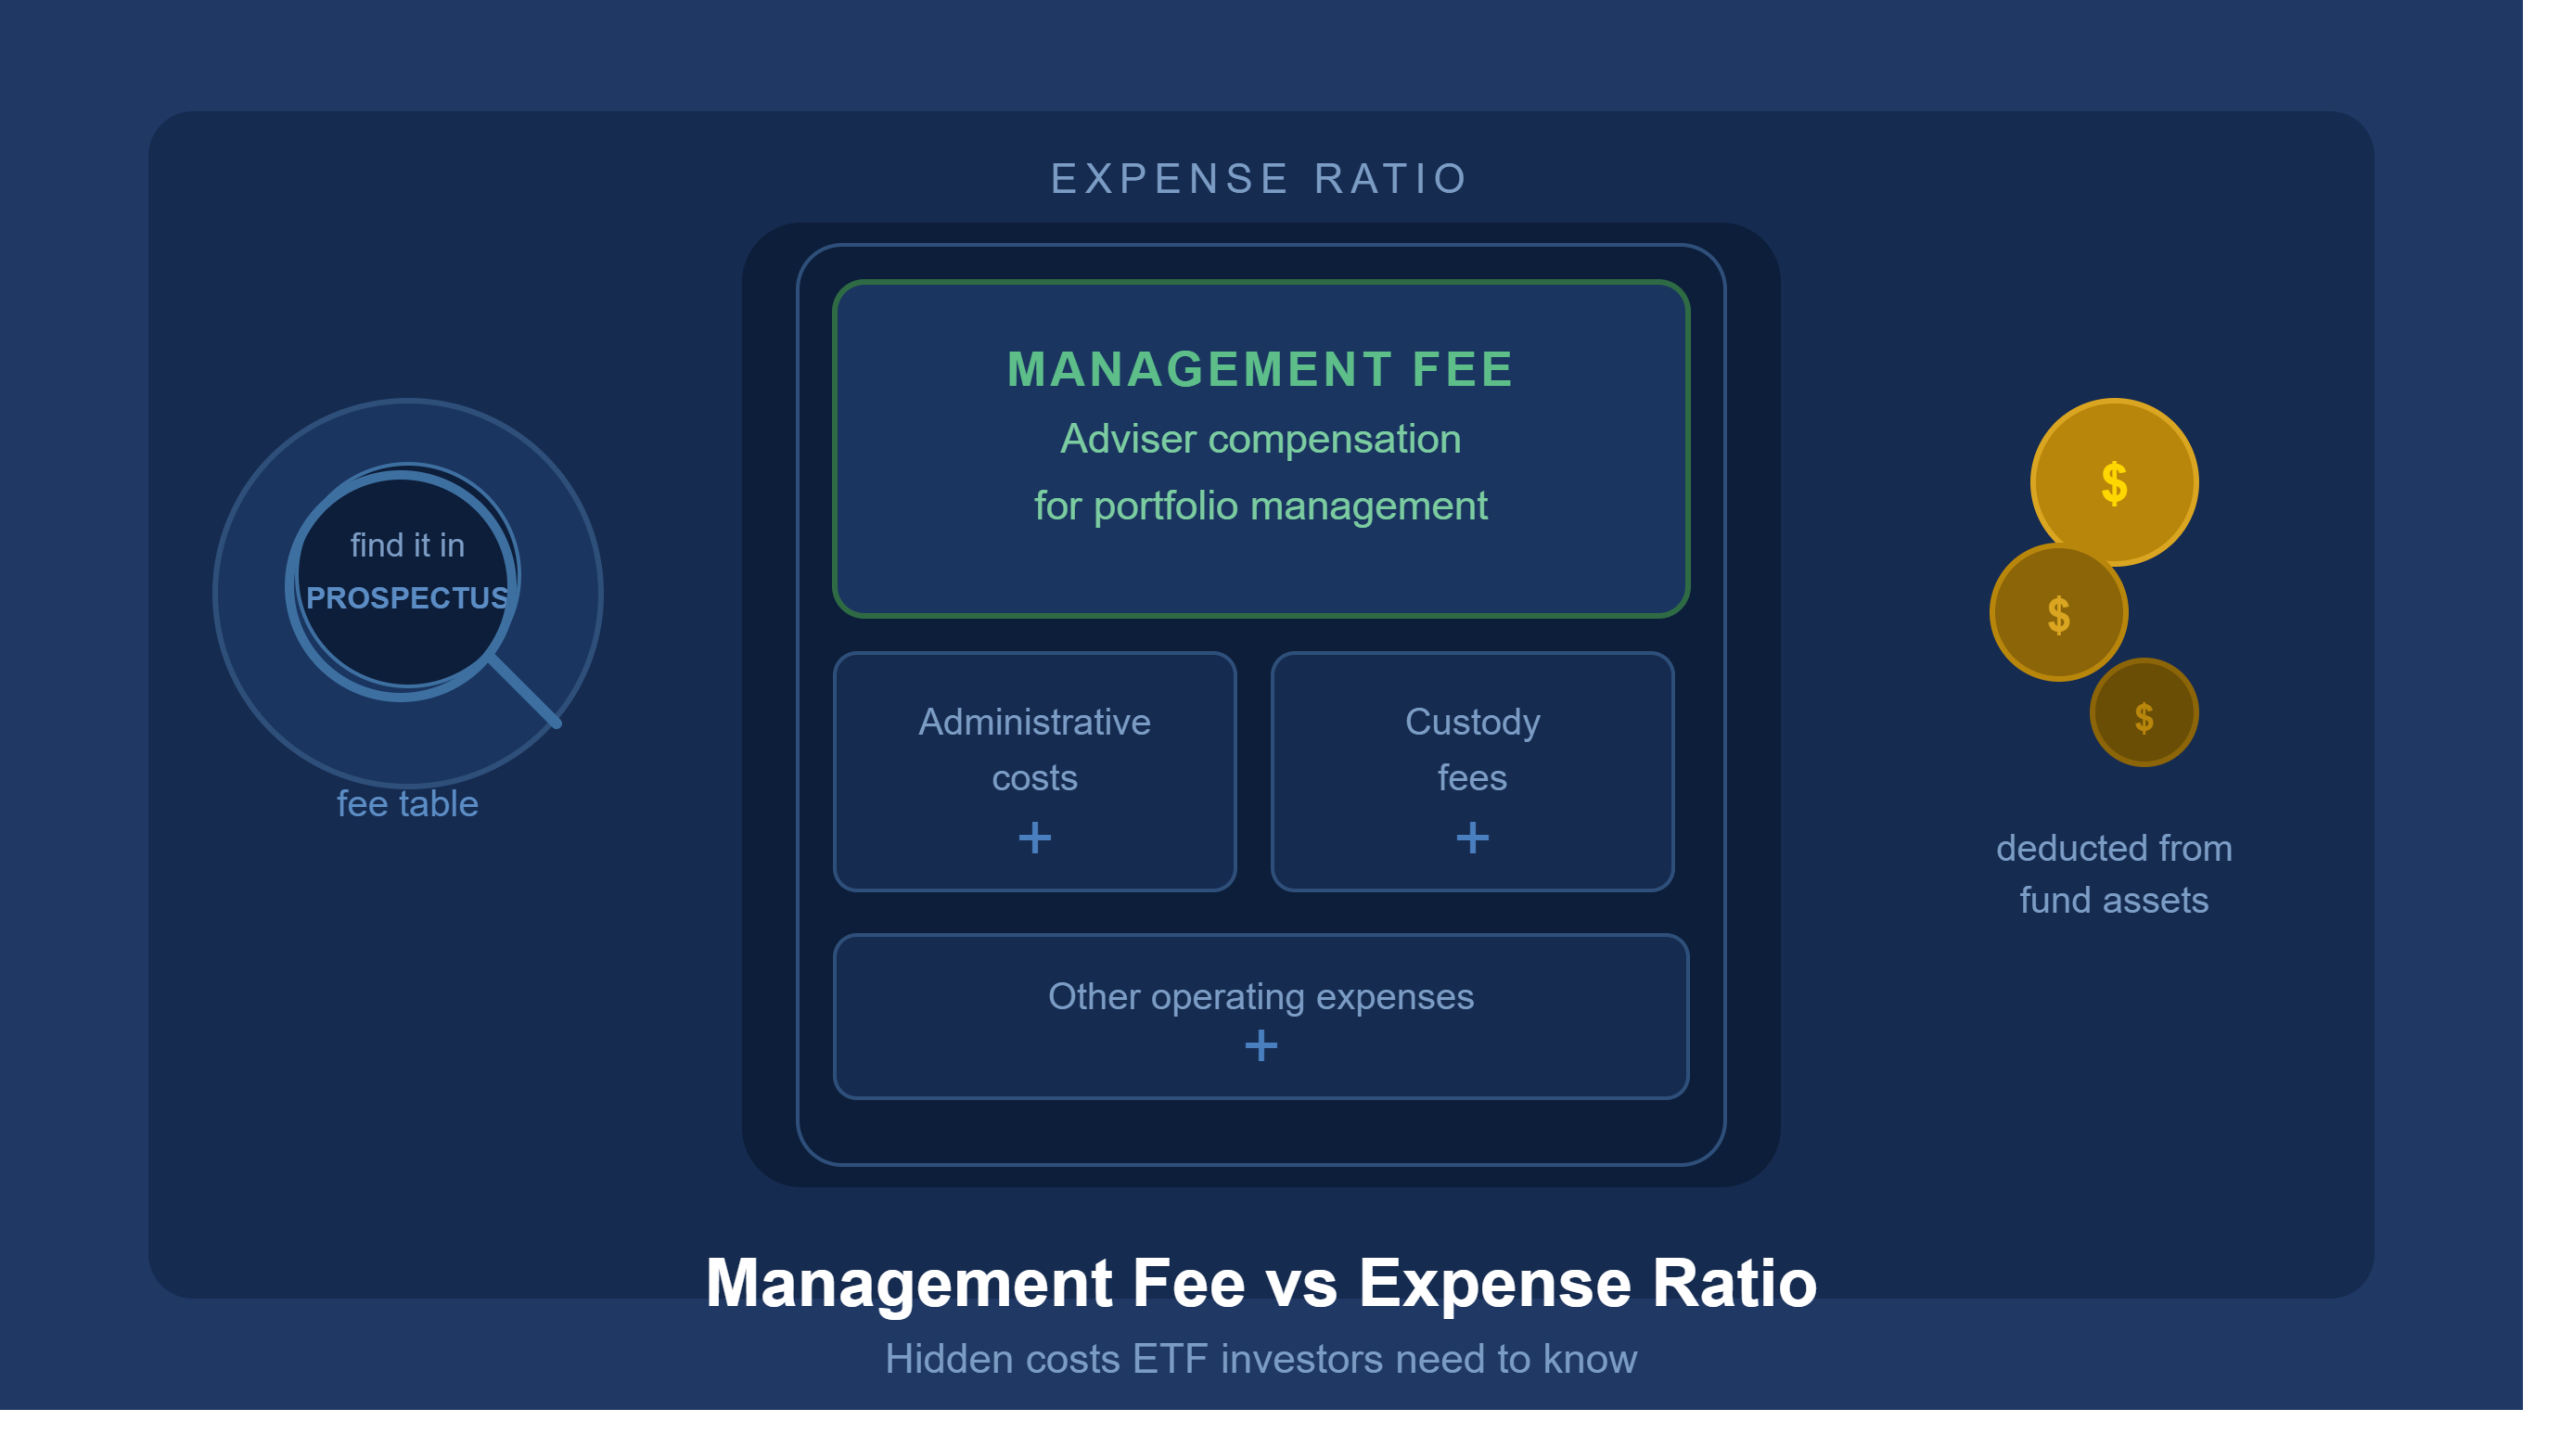
When considering whether IAU is better than GLD, investors should start by comparing their fundamental characteristics. One key differentiator is the expense ratio. While both have fairly high rates, they aren’t equal, which can factor into cost-effectiveness. However, the expense ratio is just one factor in determining the overall value and suitability of an ETF.
Another aspect to consider is the size of each fund. GLD, being larger in terms of assets under management (AUM), might provide better liquidity — an important factor for investors who value the ability to quickly and efficiently enter or exit positions. This liquidity comes at the cost of a higher expense ratio but may be justified for those who prioritize flexible trading options over minimal fees. Thus, whether IAU is better than GLD depends on the investor’s priorities: cost efficiency versus liquidity and trading volume.
GLD vs IAU: Understanding the Key Differences
While GLD and IAU both serve as popular vehicles for gold investment, delving into the specifics of each ETF reveals critical distinctions that can influence investor choice depending on their financial objectives and operational preferences.
Comparing Expense Ratios
Expense ratios are critical when choosing between GLD and IAU as they directly affect the cost of investment and, ultimately, the net return. GLD has an expense ratio of 0.40%, which, while modest, is higher than IAU’s 0.25%. This difference means that for every $10,000 invested, GLD holders will pay $40 annually in management fees compared to $25 for IAU holders.
Over time, especially in long-term investments, these costs can accumulate, potentially making a significant impact on overall investment returns. Investors who prioritize cost-efficiency may lean towards IAU, particularly if they plan to hold their positions for an extended period.
Evaluating Fund Size and Holdings
The fund size of GLD and IAU could influence an investor’s decision based on the perceived stability and liquidity each offers. GLD is notably larger, with AUM significantly exceeding IAU’s. This larger size not only suggests higher investor trust and stability but also ensures greater liquidity. Liquidity is a boon for investors who might need to execute large trades quickly without impacting the market price.
On the other hand, while smaller, IAU may appeal to investors looking for a fund that, some argue, could maneuver more quickly in response to market changes due to its relatively smaller size.
Analyzing Trading Volume and Liquidity for Investors
Trading volume and liquidity are vital metrics for investors who require flexibility in entering or exiting positions with minimal impact on price. GLD typically exhibits higher daily trading volumes than IAU, indicating more robust liquidity. This characteristic makes GLD particularly appealing to institutional investors or traders who frequently buy and sell shares.
Conversely, IAU’s lower trading volume might pose challenges during highly volatile market conditions, potentially leading to larger bid-ask spreads or difficulty executing large orders without affecting the price.
Comparing ESG Scores
Environmental, Social, and Governance (ESG) scores are increasingly important for investors prioritizing sustainability alongside financial returns. GLD and IAU, while primarily focused on tracking gold prices, differ subtly in their ESG ratings due to the operational practices of their respective managing trusts. Generally, these scores reflect the efforts made by the fund managers to minimize environmental impact and to implement socially responsible governance practices. Investors keen on supporting sustainable investment products must consider these scores, as they can vary between gold ETFs despite similar financial objectives.
Evaluating ETF Performance Metrics and Dividend Payments
Performance metrics and dividend distributions are critical for assessing the potential returns from ETF investments. Neither GLD nor IAU distributes dividends, as they are structured to reflect the price of gold minus applicable fees, not to generate income through holdings.
However, performance comparisons show that while both ETFs closely mirror gold’s price movements, one can observe nuances in their tracking efficiency. This efficiency, influenced by factors like expense ratios and fund size, plays a role in determining the exact match of the ETF performance to the underlying gold price. For long-term investors, even minor discrepancies in tracking efficiency can compound, affecting the overall investment outcome.
Expand Your Investment Portfolio With Above the Green Line
Investing in gold ETFs like GLD and IAU can be a strategic component of a diversified investment portfolio. Even so, optimizing such investments is crucial for achieving superior returns. At Above the Green Line, we specialize in providing investors with systematic strategies that highlight promising ETFs and help determine the optimal timing for buying and selling based on proprietary technical analysis.
Our approach integrates advanced metrics and tools to scan, filter, and identify the most opportune investment moments, aligning with your financial goals and risk tolerance. By leveraging the comprehensive ETF strategies offered by Above the Green Line, you ensure that your investment decisions are backed by robust analysis and tailored advice.
Discover how to enhance your investment strategy and capitalize on market opportunities by visiting our detailed guide on ETF strategies. Start aligning your portfolio for better performance today.

Related Articles
[pt_view id=”fb2451fm3r”]