
By ATGL
Updated February 2, 2026
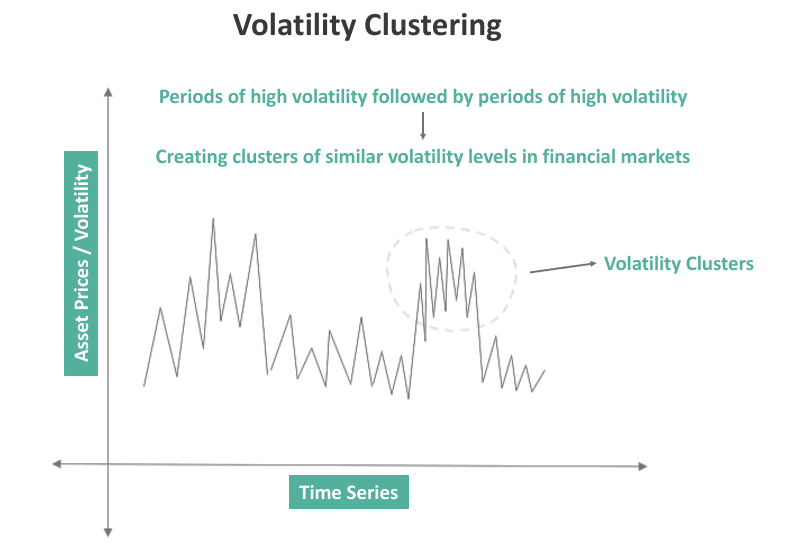
In the study of quantitative finance and market dynamics, few concepts are as foundational yet overlooked by the general investing public as volatility clustering. While many market participants view price fluctuations as random or isolated incidents, empirical data suggests a much more structured reality. Financial markets do not exhibit a constant level of turbulence; rather, they move through distinct phases where periods of relative calm are interrupted by intense, self-sustaining periods of activity.
Understanding volatility clustering in financial markets is essential for any participant engaged in risk management. This phenomenon dictates that large price changes tend to be followed by large price changes—of either sign—and small changes tend to be followed by small changes. This article examines the mechanics of clustering behavior, the psychological and structural drivers behind it, and how systematic traders utilize this knowledge to protect capital and improve execution.
What Is Volatility Clustering?
Volatility clustering is a statistical phenomenon in which the variance of financial returns appears to group together over time. First formally identified by economist Benoit Mandelbrot in 1963, the concept challenges the traditional “random walk” hypothesis, which suggests that price changes are independent of one another. Instead, clustering proves that while the direction of the next price move may be unpredictable, the magnitude of the move is often highly dependent on recent history.
Key Characteristics of Clustering Behavior
To identify volatility clustering in real-time volatility analysis, traders look for five primary characteristics:
- Persistence: High volatility tends to remain high for a duration, and low volatility tends to remain low. This creates a “sticky” environment where the current market state is the best predictor of the immediate future state.
- Large Follows Large: Significant price swings—whether bullish or bearish—frequently trigger a chain reaction of further large swings.
- Small Follows Small: During tranquil periods, the market often enters a state of equilibrium where price movements remain compressed for extended durations.
- Long Memory: The impact of a significant market shock can linger in the time series data for weeks or months, affecting how the market processes new information long after the initial event.
- Regime Switching: Markets do not transition linearly. Instead, they “flip” between tranquil regimes and turbulent regimes. This binary-like behavior is a hallmark of clustering.
Does Volatility Clustering Affect All Asset Classes?
Volatility clustering is an omnipresent feature across virtually all liquid financial markets. While most frequently discussed in the context of the S&P 500 or major equity indices, it is equally prevalent in foreign exchange (Forex), commodities, and fixed-income markets. High-frequency data suggests that as markets become more automated and interconnected, the speed and intensity of these clusters may actually be increasing, making the understanding of this concept more critical than ever for modern investors.
Why Markets Exhibit Clustering Behavior
The reason volatility clustering occurs is rooted in the complex interaction between information flow, structural market design, and human trading psychology.
News Arrival and Information Processing
Financial markets are essentially information-processing machines. However, news does not always arrive in a smooth, predictable stream. Significant events—such as central bank interest rate decisions, geopolitical conflicts, or corporate earnings surprises—often arrive in “bursts.” When a major piece of news breaks, it takes time for the market to establish a new consensus price. During this price-discovery phase, uncertainty remains high, leading to a cluster of large price adjustments as participants react to the initial news and subsequent secondary developments.
Herding Behavior and Speculative Pressure
In periods of low turbulence, investors often act independently based on fundamental valuations. However, as market fluctuations increase, a psychological shift occurs. Speculators begin to watch the actions of other participants more closely than the underlying fundamentals. This “herding behavior” leads to aligned, stronger reactions. When one large institution de-risks a portfolio, it may trigger a volatility spike that forces other institutions to do the same, creating a self-reinforcing loop of high-volatility events.
Agent-Based Models: Fundamentalists vs. Chartists
Quantitative researchers often explain clustering through agent-based models. These models suggest that the market is composed of different types of participants:
- Fundamentalists: Who trade based on long-term value.
- Chartists/Trend Followers: Who trade based on recent price history and momentum.
Volatility clusters often emerge when “chartists” gain dominance over “fundamentalists.” If trend-following algorithms and momentum traders are all triggered by the same price threshold, their collective action creates a surge in volume and variance that persists until fundamentalists perceive enough value to step in and stabilize the market.
How to Detect Volatility Clustering
Detecting the onset of a volatility cluster requires moving beyond simple price observation and utilizing specific technical indicators and statistical models.
Statistical Tools: The GARCH Model
The most famous tool for measuring clustering is the GARCH (Generalized Autoregressive Conditional Heteroskedasticity) model. Unlike standard deviations that assume a constant level of risk, GARCH models specifically account for “varying” variance. By using past variances to predict future variances, GARCH allows quantitative analysts to forecast the likelihood of continued turbulence.
Technical Indicators for Clustering
For day traders and swing traders, several accessible indicators help identify regime switches:
- Average True Range (ATR): A rising ATR over multiple periods indicates that the “large follows large” characteristic is active.
- Bollinger Band Width: When the bands remain wide for an extended period, it visualizes the persistence of high volatility.
- Historical Volatility (HV) Percentile: This measures current volatility against a historical look-back period to determine if the market has entered a high-volatility regime.
What Clustering Means for Risk Management
For the systematic investor, the primary implication of volatility clustering is that risk is not distributed evenly over time. This has profound consequences for how one manages a portfolio.
Position Sizing and Variable Volatility
If volatility is clustered, a fixed position size that is appropriate during a “small follows small” regime may be dangerously large during a “large follows large” regime. Professional risk managers often use “volatility-adjusted position sizing.” As ATR or GARCH readings rise, they reduce the number of shares or contracts held to keep the total “dollar at risk” constant.
Stop-Loss Strategy and Whipsaws
During a volatility cluster, the probability of a “whipsaw”—where the price hits a stop-loss only to reverse in the desired direction—increases. Knowing that volatility is persistent allows a trader to widen their stop-loss orders during turbulent regimes or, conversely, to avoid trading entirely until the cluster dissipates and the market returns to a tranquil state.
Tail Risk Awareness
Standard financial models often use the “Normal Distribution” (the Bell Curve), which underestimates the frequency of extreme events. Volatility clustering proves that markets have “fat tails.” Because large moves cluster together, the risk of a “Black Swan” event is significantly higher once the market has already entered a turbulent phase.
Historical Examples of Volatility Clusters
Examining historical charts provides the clearest evidence of how these clusters manifest during periods of high uncertainty.
The 2008 Financial Crisis
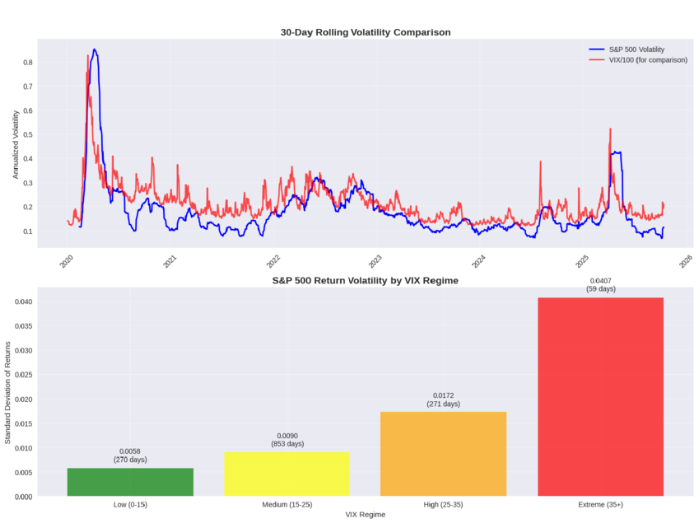
During the 2008 crisis, the equity markets did not experience a single day of high volatility followed by immediate calm. Instead, from September 2008 through early 2009, the market entered a massive volatility cluster. The VIX (Volatility Index) stayed at elevated levels for months, and daily swings of 3% to 5% became the “new normal.” This was a classic “large follows large” regime driven by institutional herding and constant negative news arrival regarding the banking sector.
The 2020 COVID-19 Crash
In February 2020, markets transitioned from an exceptionally low-volatility regime to one of the most intense volatility clusters in history in less than two weeks. This “regime switch” was triggered by the sudden realization of a global pandemic. The persistence of high volatility lasted until late April 2020, as the market struggled to price in the unprecedented economic shutdowns.
How Traders Adapt to Volatility Clustering
Successful market participation requires a tactical shift when the environment moves from tranquil to turbulent. This “regime identification” is a core component of systematic trading.
Tactical Shifts and Asset Allocation
When a volatility cluster is detected in equities, many tactical investors shift their asset allocation toward lower-beta assets or cash. Conversely, some traders thrive on volatility clustering by using strategies like “volatility expansion” breakouts, which seek to capture the momentum of the “large follows large” swings.
Opportunity Sizing
In a low-volatility cluster, traders might use higher leverage because the “per-bar” risk is low. In a high-volatility cluster, they prioritize capital preservation over aggressive gains. By aligning the strategy with the current volatility regime, traders avoid the common mistake of applying “quiet market” tactics to “loud market” conditions.
Expert Tools and Guidance
Identifying the transition between market regimes is one of the most difficult skills in finance. It requires a combination of high-frequency data, statistical awareness, and a calm, emotionless approach to the markets. Modern systematic tools can help traders spot these clusters as they form, providing the “long memory” needed to anticipate how long a turbulent phase might last.
To refine your ability to navigate market regimes and to access professional-grade risk management strategies, join a community that prioritizes data-driven insights over emotional reactions. Explore the advanced tools and community support available at Above the Green Line Memberships.
Conclusion
Volatility clustering in financial markets is not merely a statistical curiosity; it is a fundamental law of market behavior. By acknowledging that volatility is persistent and that regimes of calm and turbulence are distinct, investors can move away from the dangerous assumption of constant risk.
Whether you are a day trader looking for the next “large follows large” opportunity or a long-term investor seeking to protect your portfolio from tail risk, understanding clustering is essential. By monitoring indicators like ATR, utilizing models like GARCH, and adjusting position sizes to match the current volatility regime, you can transform market turbulence from a source of anxiety into a manageable component of your systematic trading plan.

Related Articles

Penny Stocks: How to Identify High-Probability Setups Using Rules-Based Investing

Margin Call Explained: What Triggers It and How to Avoid One

AMC Short Squeeze Explained: Timeline, Causes, and Trading Risks

Chaikin Money Flow (CMF): How to Use Volume to Spot Real Market Strength
