By ATGL
Updated January 1, 2025
Investors often find themselves at a crossroads when deciding between small-cap and large-cap investments. The choice can significantly impact portfolio performance, especially in today’s volatile market. Understanding the nuances between these two asset classes is essential for making informed decisions.
The iShares Russell 2000 ETF (IWM) targets the small-cap segment of the market, representing the bottom 2000 stocks in the Russell 3000 Index. Conversely, the Invesco QQQ Trust (QQQ) focuses on large-cap growth stocks, comprising the top companies listed on the Nasdaq. Each fund offers unique exposure, risk, and potential rewards that can shape an investment strategy.
This article delves into a detailed comparison of IWM and QQQ, highlighting their characteristics, performance metrics, and investment focuses. By examining these two distinct funds, we aim to provide clarity on the advantages and disadvantages inherent in small-cap versus large-cap growth investing.
What is IWM?
The iShares Russell 2000 ETF, often referred to by its ticker symbol IWM, is a popular exchange-traded fund. It aims to replicate the performance of the Russell 2000 Index. This index is a widely recognized benchmark for U.S. small-cap stocks, providing investors exposure to a broad range of companies with smaller market capitalizations.
Overview of iShares Russell 2000 ETF
Launched on May 22, 2000, under the management of BlackRock, the iShares Russell 2000 ETF tracks the Russell 2000 Index. As of the latest reports, it manages around $81.6 billion in assets. The fund invests in both growth and value stocks, focusing on small-cap companies. With an expense ratio of 0.19%, the ETF is cost-efficient. It holds about 1,981 stocks, boasting a dividend yield of 1.14%. This makes it attractive for investors looking for income and diversification.
Inception date and fund family
The iShares Russell 2000 ETF was launched on May 22, 2000. It is part of the BlackRock/iShares fund family, a notable name in the investment industry. The fund focuses on small-cap equities and follows a passive management style to mimic the Russell 2000 index. With significant assets under management, it plays a vital role in many investors’ portfolios seeking small-cap exposure.
Net assets and market capitalisation
The iShares Russell 2000 ETF holds net assets of approximately $81.6 billion. Primarily investing in small-cap stocks, the fund is categorized as a Small Blend equity fund. It holds significant investments in fossil fuel stocks, totaling about $6.02 billion, which represents 7.37% of its assets. The ETF’s price stood at $222.39 as of December 28, 2024. This valuation reflects the collective market influence of the many small-cap companies within its portfolio.
Key Characteristics of IWM
The iShares Russell 2000 ETF, with the ticker symbol IWM, tracks a market-cap-weighted index specifically of US small-cap stocks. These stocks are ranked from 1,001 to 3,000 by market capitalization. As of December 24, 2024, the ETF holds 1,981 different stocks. This provides a wide range of diversification within the small-cap market. With an expense ratio of just 0.19%, IWM is a cost-effective choice for those wanting exposure to small-cap stocks. The fund has impressive liquidity, with an average daily volume of 33.74 million shares. Its Assets Under Management (AUM) are $74.41 billion, highlighting its popularity and trustworthiness among investors.
Top Holdings and Sector Diversification
IWM holds a varied portfolio, including top stocks like FTAI Aviation Ltd. and Sprouts Farmers Market, each accounting for about 0.48% of the fund’s assets. With a total of 1,981 holdings, IWM showcases extensive diversification within the small-cap sector. The fund follows a passive management style by tracking the Russell 2000 index. This index focuses on small-cap stocks, often featuring micro-cap companies. Classified as a Small Blend fund, IWM provides exposure across different sectors, with an emphasis on small-cap equities. Currently, the portfolio shows a beta of 1.16, suggesting it is riskier than the neutral benchmark, due to its small-cap orientation.
Performance Metrics and Historical Context
As of November 30, 2024, IWM has total net assets of approximately $81.6 billion, signifying its strong presence in the small-cap investment arena. IWM is part of the Morningstar Small Blend category, aligning with both growth and value strategies focused on small-cap stocks. Launched on May 22, 2000, IWM has fostered investment in small-cap stocks, reflecting growing interest in this market segment. Managed by BlackRock/iShares, the ETF has seen leadership changes including Greg Savage since January 2008 and Paul Whitehead since January 2022. With daily pricing frequency, investors receive up-to-date metrics, capturing the volatility typical of small-cap investments.
Average Annual Return and Growth of an Initial Investment
IWM has achieved notable returns over varying periods. As of November 30, 2024, it posted an average annual price return of 36.32% over the past year. Over three years, the return stood at 4.93%, while the five-year average was 9.80%. Looking at a ten-year span, IWM delivered an average annual price return of 9.02%. Since its inception in May 2000, the ETF has provided investors with an 8.27% average annual price return. This track record highlights the potential growth of IWM in an investor’s portfolio over time.
What is QQQ?
The Invesco QQQ Trust, symbolized as QQQ, is an exchange-traded fund (ETF). It seeks to mirror the performance of the Nasdaq-100 Index. This index represents the top 100 non-financial companies on the Nasdaq stock exchange. QQQ is most known for its high concentration in large-cap growth stocks. These often include major technology players like NVIDIA and Apple. As of the latest data, QQQ was trading around $522.50. Investors often choose QQQ for access to a portfolio filled with large-cap growth securities.
Overview of Invesco QQQ Trust
The Invesco QQQ Trust focuses on the largest non-financial companies on the Nasdaq. Most of these are in the technology and growth sectors. The value of QQQ was recently noted at approximately $522.50, showing a daily change of 1.34%. The fund is popular among investors wanting exposure to big growth stocks.
Here’s a quick rundown of QQQ features:
– Asset Type: Large-cap growth stocks
– Concentration: Technology-heavy
– Current Price: Approximately $522.50
– Market: Traded on major stock exchanges
QQQ is often compared to other ETFs and indices. One common comparison is with the SPDR S&P 500 ETF Trust (SPY). Another is the iShares Russell 2000 ETF (IWM), which focuses on small-cap stocks. Such comparisons help investors distinguish between large-cap and small-cap investment opportunities.
Key Characteristics of QQQ
The Invesco QQQ Trust, or QQQ, is a popular exchange-traded fund (ETF). It focuses on the top 100 non-financial companies listed on the Nasdaq stock market. These companies are mostly large-cap growth stocks, often in the tech sector.
Key Characteristics of QQQ:
– Market Focus: Invests in the Nasdaq-100 Index.
– Current Price: Approximately $522.56 with a recent 1.33% change.
– Sector Emphasis: Heavy exposure to technology companies.
– Benchmark Role: Serves as a performance standard for large-cap tech investments.
– Influential Stocks: Key holdings include NVIDIA Corp and Apple Inc.
Performance Highlights:
- Large-cap growth focus.
- Significant price movements impacting market trends.
- Acts as a benchmark in tech investment strategies.
Table: Notable Holdings
| Company | Sector |
|---|---|
| NVIDIA Corp | Technology |
| Apple Inc | Technology |
QQQ offers a strategic position for investors aiming to benefit from tech sector growth. Its composition and performance are key metrics for tech-savvy market participants.
Comparison of Investment Focus
The iShares Russell 2000 ETF (IWM) targets small-cap stocks, tracking the smallest 2,000 companies in the Russell 3000 Index. This gives investors focused exposure to the U.S. small-cap equity market, which can be appealing for those seeking higher growth potential.
Key Features of IWM
- Number of Holdings: 1,981 companies
- Major Sectors: Financial Services, Healthcare
- Expense Ratio: 0.19%
- Net Assets: $81.6 billion
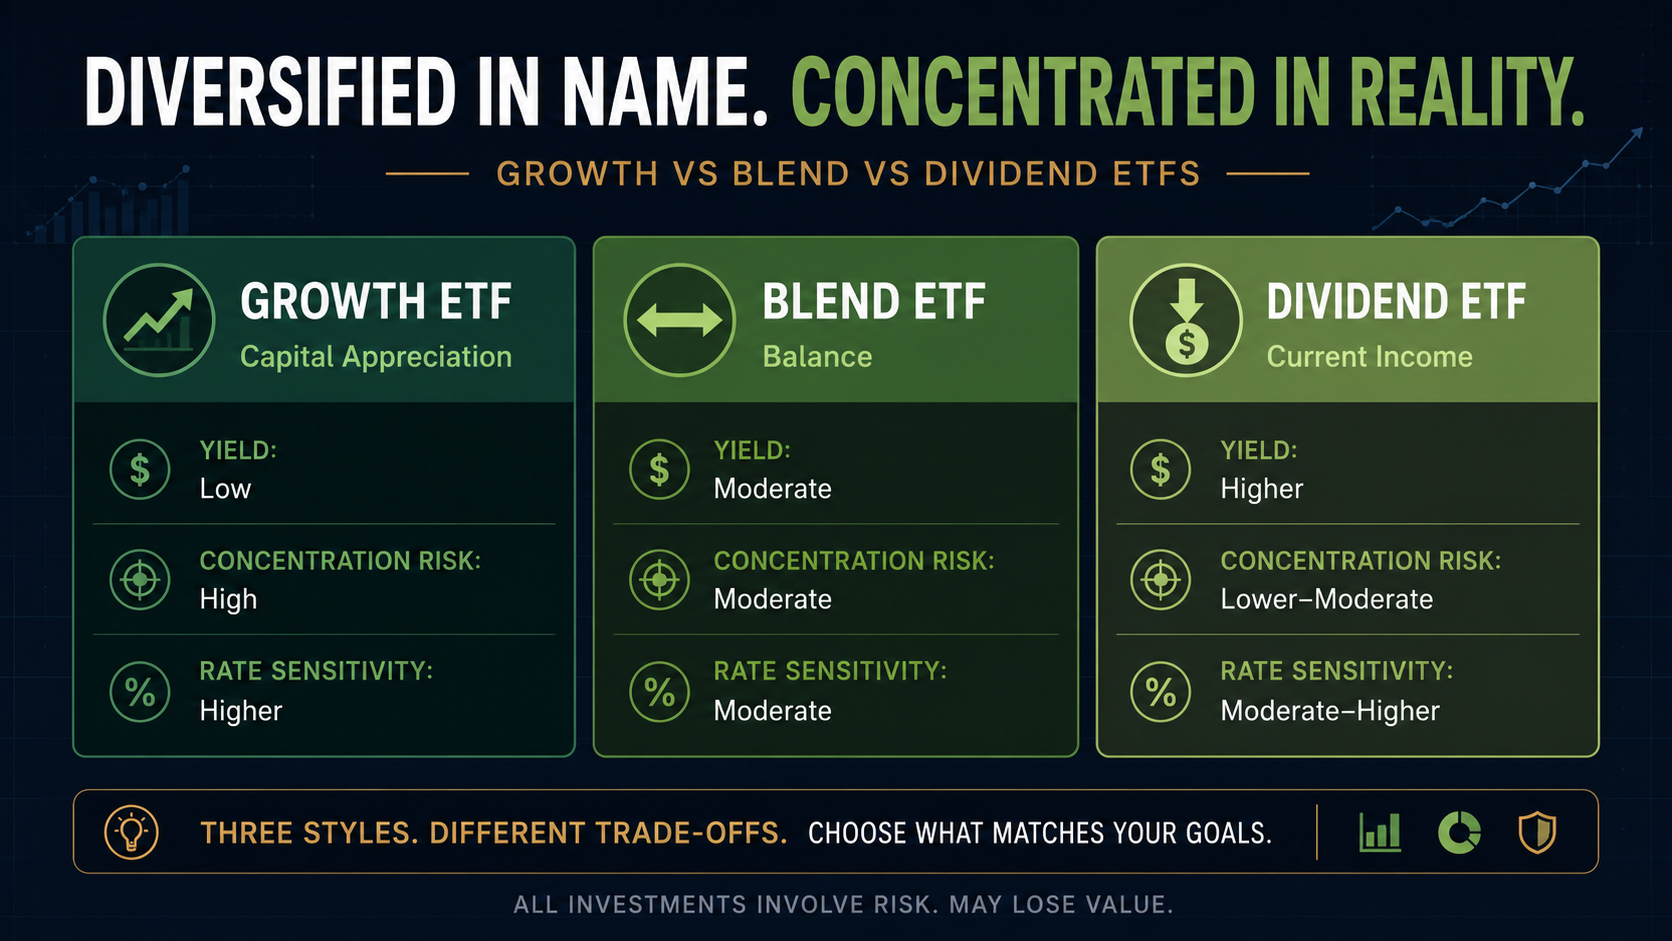
Small-Cap Growth vs. Large-Cap Growth
Small-cap stocks, such as those in IWM, are often more volatile but offer the potential for higher returns. These stocks tend to excel in certain economic conditions, whereas large-cap stocks are typically more stable and perform better during periods of higher interest rates.
Strengths and Weaknesses of Small-Cap Investments
Strengths:
- Greater potential for high returns.
- Diversification across nearly 2,000 companies.
- Opportunities for targeted growth strategies.
Weaknesses:
- Higher volatility and risk.
- May underperform in adverse economic conditions.
Strengths and Weaknesses of Large-Cap Investments
Strengths:
- Lower volatility and more stability.
- Resilience during economic downturns.
Weaknesses:
- Potential for slower growth compared to small-cap stocks.
- Greater exposure to concentration risk.
Large-cap stocks often provide a safer option in uncertain markets, while small-cap stocks capitalize on growth opportunities during favorable economic conditions. Investors should weigh these factors against their risk tolerance and investment goals to choose the right strategy.
Performance Comparison: IWM vs. QQQ
When comparing the iShares Russell 2000 ETF (IWM) with QQQ, these funds represent different segments of the market. IWM focuses on small-cap stocks, while QQQ tracks large-cap technology stocks in the NASDAQ-100. Understanding how each performs and the risks involved is essential for making informed investment decisions.
Historical performance analysis
The iShares Russell 2000 ETF (IWM) has delivered strong returns over time. As of December 27, 2024, IWM boasts a year-to-date (YTD) return of 10.80%. Over five years, it has achieved a return of 33.42%. Since its inception in 2000, it has maintained an average annual return of 8.27%. This reflects the potential of small-cap stocks, which often grow faster than large-cap counterparts.
Historical Performance Summary:
– YTD Return (2024): 10.80%
– Five-Year Return: 33.42%
– Average Annual Return: 8.27% (since 2000)
Recent performance trends
In recent months, IWM has faced some volatility. By December 27, 2024, it experienced a slight decline of 1.46%. Despite this, its YTD growth remains at 10.80%, and in the last six months, it has increased by 11.18%. Even over one year, IWM has managed an 8.96% return. This highlights IWM’s recovery performance after market downturns.
Risk assessment and volatility comparison
Small-cap stocks in the Russell 2000 Index can be more volatile than large-cap stocks. This is due to their sensitivity to market shifts. IWM, tracking these stocks, often sees more fluctuations compared to QQQ, which focuses on large, established companies. While risky, investing in IWM can yield high returns due to its diverse holdings. With a price-to-earnings (P/E) ratio of 73.79, IWM indicates a high valuation, and its expense ratio of 0.19% reflects management costs. Investors should consider these factors when evaluating potential risks and rewards.
Research Insights and Recent News
The iShares Russell 2000 ETF (IWM) is one of the leading exchange-traded funds that focuses on small-cap stocks in the U.S. It tracks a market-cap-weighted index of companies ranked 1,001 to 3,000 by market cap. On December 24, 2024, IWM included 1,981 holdings. The top sectors were Financial Services (16.92%), Healthcare (16.34%), and Industrials (16.32%). This diversification provides a broad spectrum of small-cap exposure for investors.
In terms of performance, IWM reported a remarkable 1-year price return of 36.32% and an 8.27% return since its inception. This strong performance aligns with recent market trends showing small-cap companies gaining momentum. Economic conditions and potential changes in Federal Reserve policy offer favorable tailwinds for IWM. The ETF’s expense ratio of 0.19% makes it a cost-effective option for those seeking to invest in small-cap stocks.
Current Events Impacting IWM
Recently, IWM has shown signs of bullish momentum. The ETF broke its downtrend and is consolidating around the $225 level. It’s supported by the 9 EMA and 21 EMA, which are technical indicators that suggest possible growth. IWM recovered from a low of $216, positioning itself for potential upside if resistance levels are broken. As of December 27, IWM closed at $222.39, a decline of 1.46% for that day. However, year-to-date, it has gained 10.80%.
The market structure is also evolving, with a potential falling wedge forming on IWM’s 4-hour chart. This complex pattern can signal new opportunities for investors. It will be crucial to watch how IWM navigates its resistance levels in the coming weeks.
Current Events Impacting QQQ
The QQQ ETF, known for tracking large-cap growth stocks, is also seeing market shifts. Investors are paying close attention to Federal Reserve announcements and any economic data that might influence market behavior. These elements directly affect QQQ’s performance.
Equity futures have shown mixed signals, reflecting investor sentiment ahead of Federal Reserve decisions. The anticipation of rate cuts has increased interest in ETFs like QQQ. However, there is ongoing speculation about a possible market correction and its impact on QQQ. Analysts continue to evaluate future prospects given the economic backdrop and investor tendencies.
Analyst Ratings and Forecasts
For the iShares Russell 2000 ETF (IWM), recent trading data is key. On December 27, IWM opened at $224.26 and closed at $222.39, marking a daily decline of 1.46%. As of December 24, IWM’s price-to-earnings ratio was 73.79, suggesting a high valuation. This metric is critical as analysts consider future forecasts and ratings.
The ETF’s assets under management (AUM) were sizable at $74.41 billion, indicating its strong market presence among small-cap investments. With an expense ratio of 0.19%, IWM remains a compelling choice for cost-conscious investors. The 52-week high and low for IWM were $244.98 and $187.53, respectively. These figures guide analyst forecasts and underpin their investment strategies.
Competing ETFs Overview
The iShares Russell 2000 ETF (IWM) is an exchange-traded fund that tracks the Russell 2000 Index. This index includes the 2,000 smallest companies from the Russell 3000 Index, providing investors with access to small-cap stocks. The ETF’s structure is float-adjusted and market-cap-weighted. This means that larger companies within the index have more influence on its performance. IWM offers a diversified portfolio, reducing the risk of investing in single companies. Its expense ratio of 0.19% makes it a cost-effective choice for those interested in small-cap equities. However, investors should be aware that small-cap stocks can be more volatile than large-cap stocks, offering both higher risks and greater potential returns.
Other small-cap ETFs to consider
The iShares Russell 2000 ETF (IWM) is noteworthy for tracking mid and small-cap U.S. stocks, including the smallest 2,000 companies in the Russell 3000 Index. This fund is known for its diversification, making it one of the most comprehensive within the small-cap segment. However, its exposure to micro-cap stocks can make it riskier than more traditional benchmarks. This risk is often measured by beta. Despite risks, IWM has shown positive returns recently. A hawkish Federal Reserve decision caused a significant price slump, but its current trading below historical price-to-earnings (P/E) averages may offer investment opportunities.
Other large-cap ETFs to consider
With $74.94 billion in assets, the iShares Russell 2000 ETF (IWM) is a prominent option focused on small-cap stocks. The fund has 1,981 holdings, especially in Financial Services, Healthcare, and Industrials sectors. Despite being a small-cap fund, its vast assets often lead investors to compare it with large-cap ETFs. IWM’s price-earnings ratio is 73.79, suggesting a specific valuation level when considering earnings. The recent trading range of $220.20 to $225.44, along with a 52-week range of $187.53 to $244.98, reveals its market dynamics.
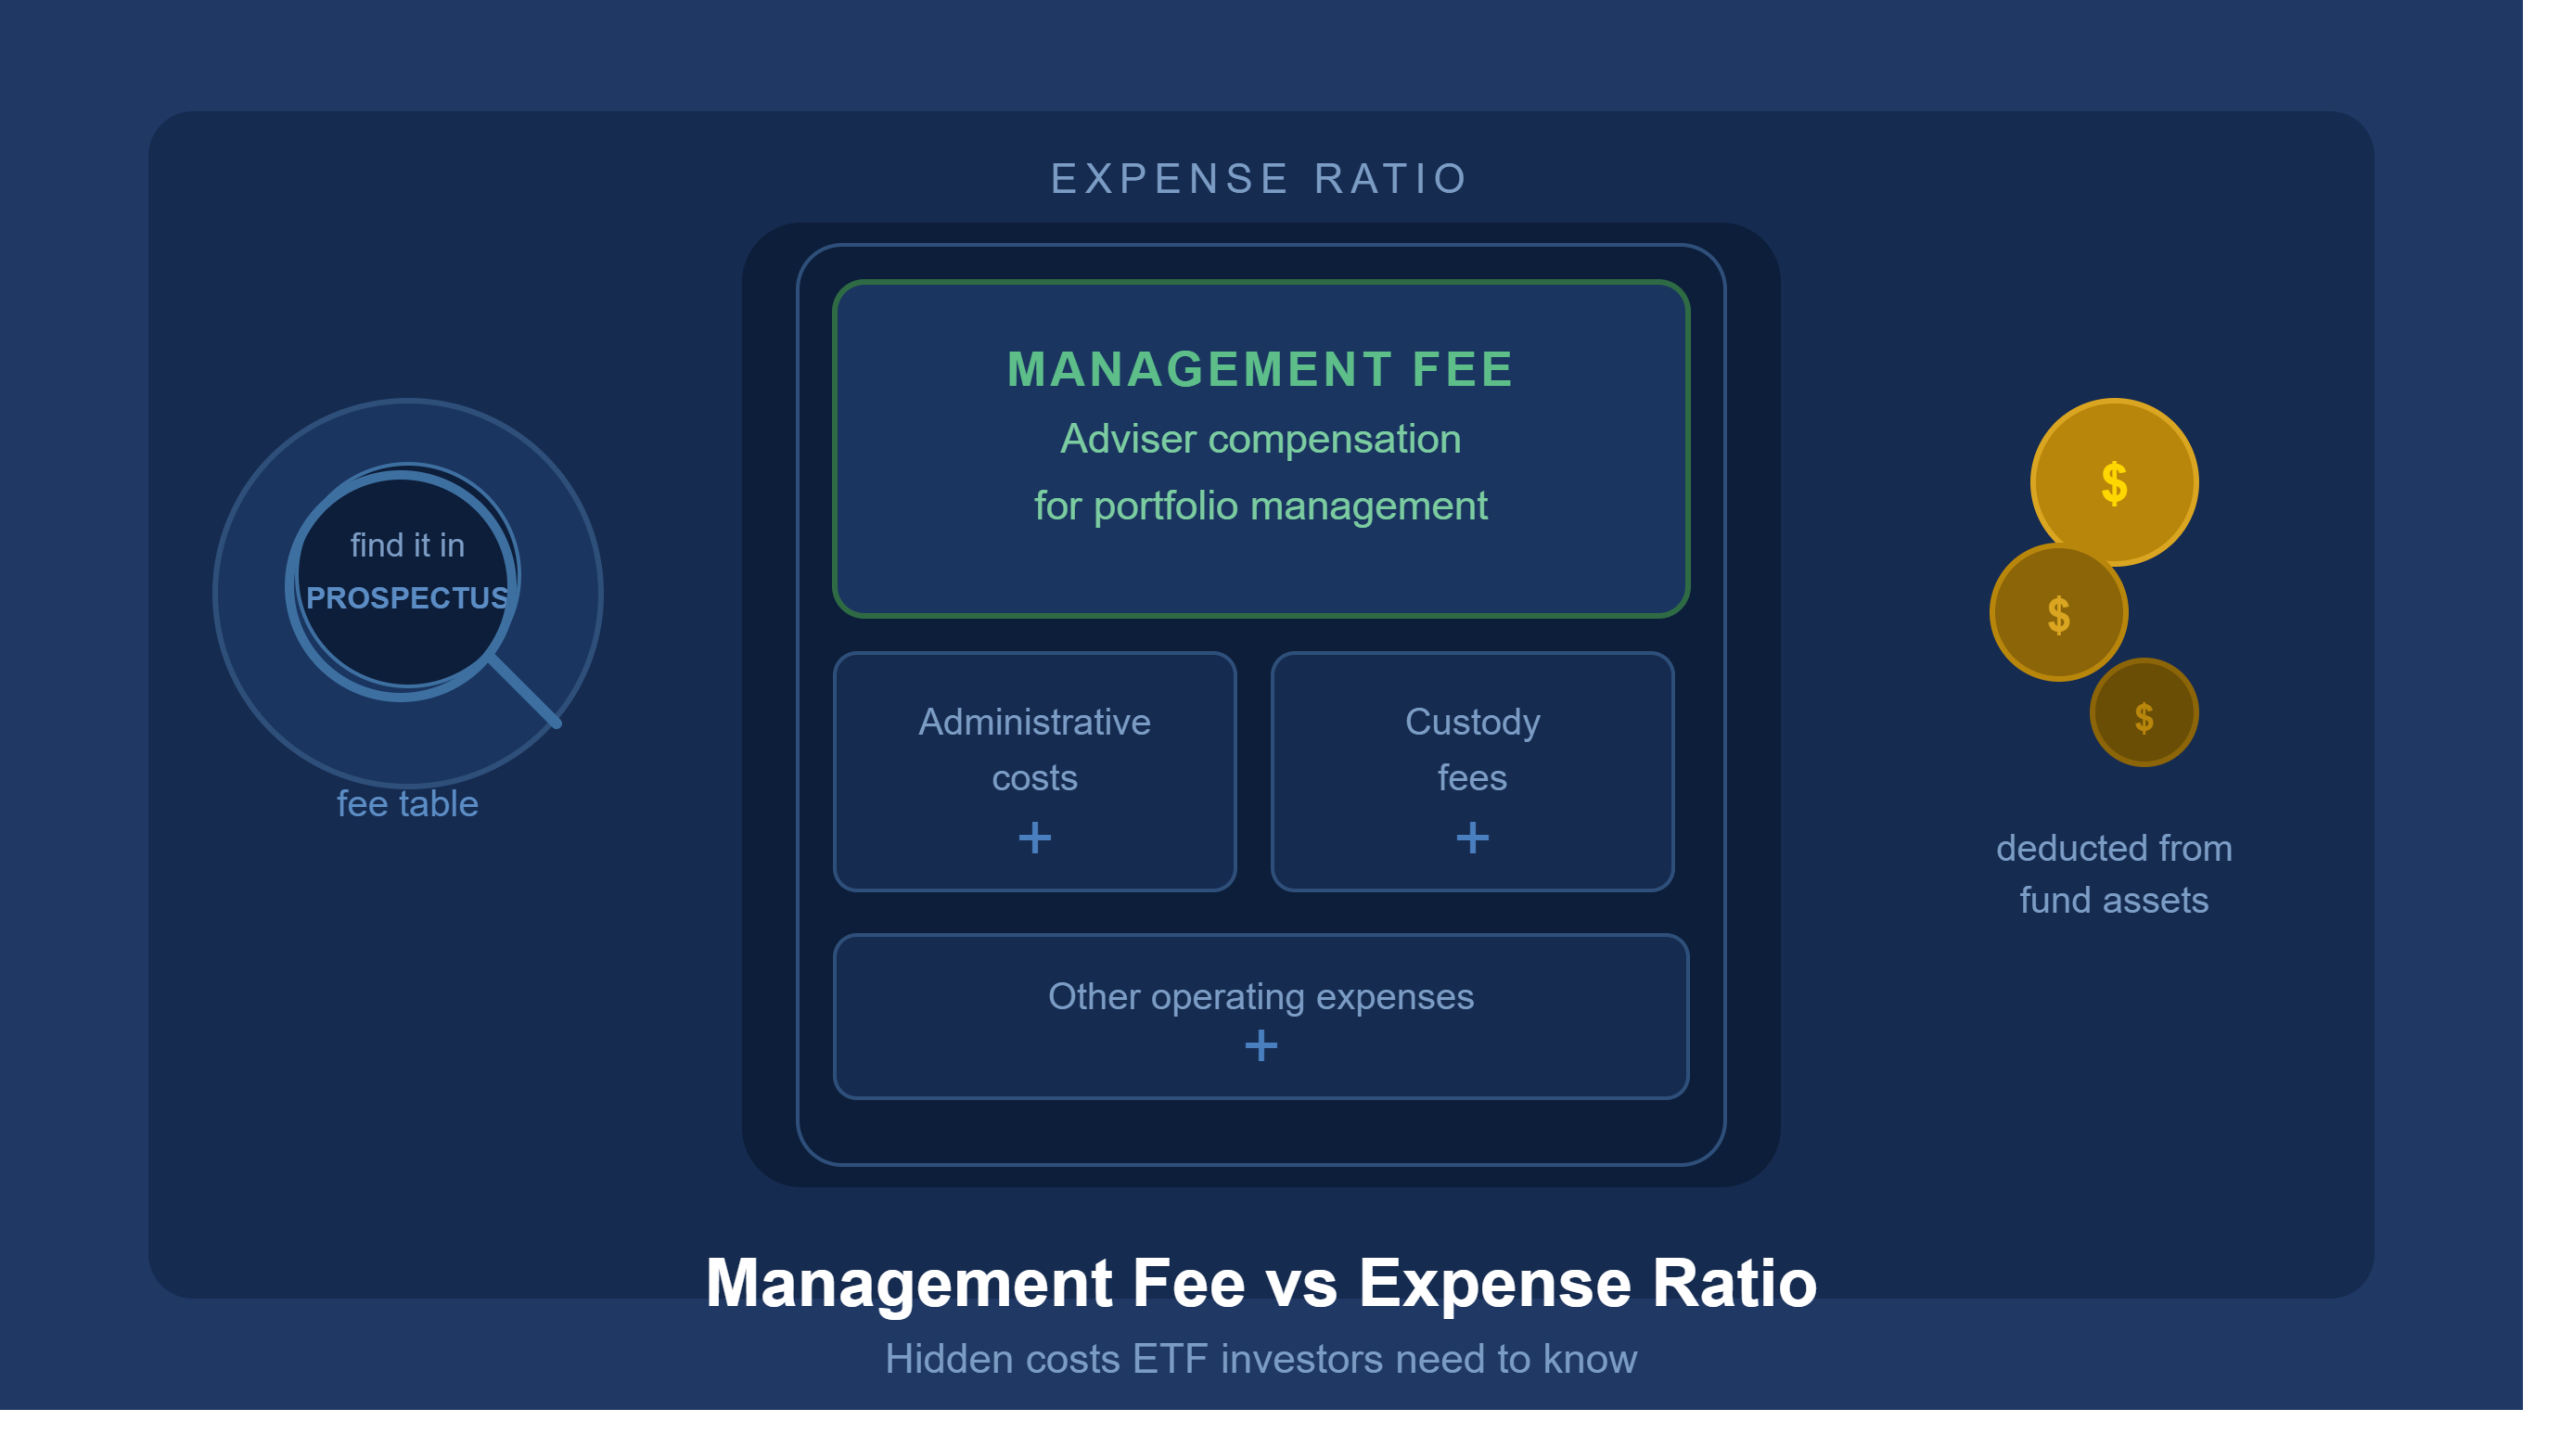
Comparison of fees and expenses
When considering investment options, fees and expenses play a critical role in determining long-term returns. Both the iShares Russell 2000 ETF (IWM) and the Invesco QQQ Trust (QQQ) offer cost-effective exposure to their respective markets, but their expense ratios differ significantly due to the unique nature of their holdings and strategies.
The iShares Russell 2000 ETF (IWM) has an expense ratio of 0.19%, which is competitive for small-cap ETFs. This fee reflects the costs of managing and maintaining a portfolio of nearly 2,000 small-cap companies, which often require more intensive tracking and adjustments due to higher volatility and liquidity challenges in the small-cap market. Despite this slightly higher expense ratio compared to large-cap ETFs, IWM remains an affordable choice for investors seeking diversified exposure to the U.S. small-cap equity market.
On the other hand, the Invesco QQQ Trust (QQQ) boasts a lower expense ratio of 0.20%, providing cost-efficient exposure to the 100 largest non-financial companies listed on the Nasdaq. These companies, typically large-cap and tech-driven, tend to have more predictable performance and lower turnover, which helps keep management costs down. While QQQ’s expense ratio is slightly higher than some other large-cap ETFs, its focus on innovative and high-growth companies often justifies the expense for investors seeking exposure to the technology and growth sectors.
Although the expense ratios of IWM and QQQ are comparable, their impact on returns can vary depending on an investor’s time horizon and portfolio size. For example, investors with a long-term focus on small-cap growth may find IWM’s slightly lower expense ratio appealing, especially when balanced against the potential for higher returns from small-cap stocks. Conversely, QQQ’s emphasis on large-cap, growth-oriented companies offers a more stable and predictable cost structure, appealing to investors who prioritize lower risk and steady performance.
Ultimately, the choice between IWM and QQQ depends on an investor’s objectives, risk tolerance, and preference for small-cap versus large-cap exposure. While fees and expenses are an important consideration, they should be evaluated alongside other factors such as performance potential, diversification, and economic conditions to ensure alignment with an investor’s financial goals. Join Above the Green Line and learn more about the differences between IWM and QQQ and which best fits your portfolio.

Related Articles
[pt_view id=”fb2451fm3r”]