
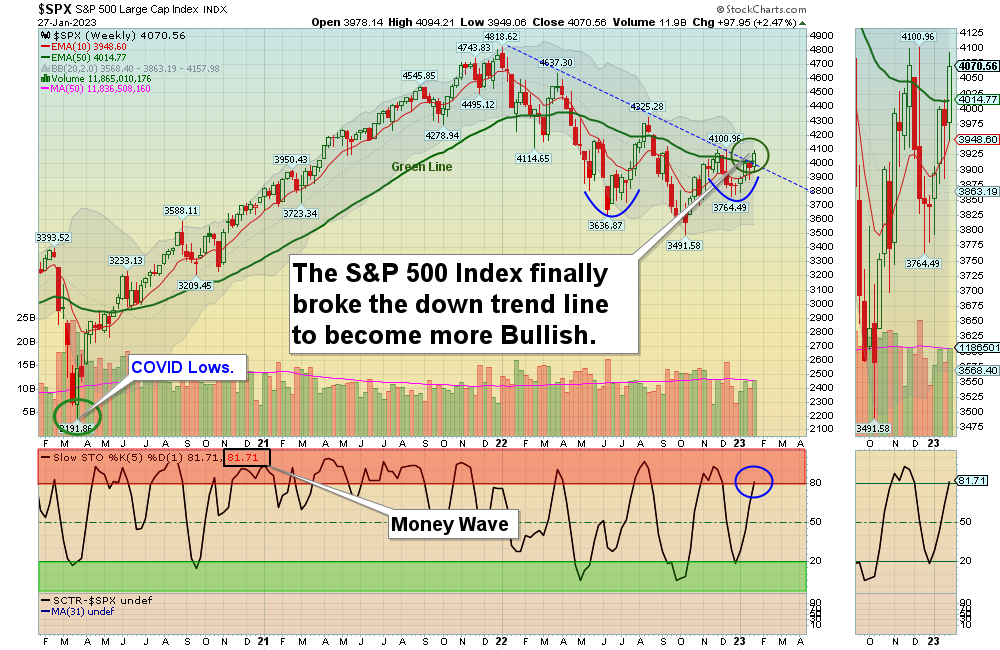
1/29/2023 Markets were higher for the week as the S&P 500 and Small Cap Indices were able to join the DOW 30 and close back Above the Green Line. Now the S&P 500 has Resistance at 4101 to get thru for more upside. It looks like the FED will raise short term Interest Rates by only 1/4 point this time, so the Markets seem to be excited about that.
But long term Interest Rates have dropped 18 % from the October high of 4.42% down to 3.6% with a peak in Inflation. There is still a high probability that the Inverse Bond Fund (TBT) will go up once more (meaning higher long term Interest Rates for a while). Maybe the massive spending by Congress ($1.7 TRILION recently) is the new “sugar high” as Steel and Gold made new highs for the week.
Many of the weak stocks (AMC LCID MARA RBLX TARK TSLA TSLL) that made 52 week lows in December have had big Short Covering bounces, but they should eventually go back down and retest the Lows.
If you continue to Follow the Green Line System, your Money should flow into the Strongest areas and your account value should be able to grow in both Bull and Bear Markets. Follow the MONEY, not the MEDIA..
______________________________________________________________________________________________________________________________________________
For the week the Dow was up 1.78%, the S&P 500 was up 2.48% and the NASDAQ 100 was up 4.80%. Most of the major Indices do not have Relative Strength above 80, so you should currently own the stronger Securities here.
The Inflation Index (CRB) was down 0.28% for the week and is Above the Green Line, indicating Economic Expansion.
Bonds were up 0.48% for the week, and are Below the Green Line, indicating Economic Expansion.
The US DOLLAR was down 0.06% for the week and is Below the Green Line.
Crude Oil was down 2.40% for the week at $79.68 and GOLD was up 0.06% at $1929.40.
More action this week on the Day Trading Scrolling Charts.
DAY TRADING CHARTS FOR INDICES & LARGE CAPS.
We have not had many intra-day Trade Alert signals lately as the Volume has been too Low with the Buy Signals. These low Volume Buy Signals tend to pop up and quickly fade back down. We like to see High Volume on rallies.
_____________________________________________________________________________________________
MONEY WAVE BUYS SOON:
We are in now in 5 logged Current Positions for the Short & Medium Term. There are 5 investments on the Short Term Watch List.
Be patient and WAIT for Green Zone Buy Signals!
LONG TERM INVESTMENTS: (It is still hard to find many Long Term now because most normal Investments no longer have 80 Relative Strength required.)
Long Term Scrolling Charts (Real Time)
GIS GENERAL MILLS INC. Wait for Weekly Money Wave Close > 20 with High Volume.
HRB H&R BLOCK INC. Buy above $38.66 with High Volume with a 3% Trailing Sell Stop Loss below it.
SH INVERSE S&P 500 FUND Buy above $17.71 with High Volume with a 3% Trailing Sell Stop Loss below it.
TWNK HOSTESS BRANDS Buy above $23.49 with High Volume with a 3% Trailing Sell Stop Loss below it.
VIPS VIPSHOP HOLDINGS Buy on the next Daily Money Wave Buy Signal. (Recent pop had low Volume).
______________________________________________________________________________________________________
My Trading Dashboard
Swing Trading Scrolling Charts
Day Trading Scrolling Charts
Click for Watch Lists
Click for Current Positions
Click for Closed Positions
Updated Top 100 List Jan 2, 2023
Dividend Growth Portfolio
Updated ETF Sector Rotation System
Dogs of the DOW System
Long Term Strategy for IRAs & 401k Plans
CNN Fear & Greed Index
Scrolling Stage Chart Investing Charts
Alert! Market Risk is High (RED). The probability of successful Short Term Trades is better, when the % of stocks above the 50-day avg. is below 20.
Tell your Friends about the Green Line, and Help Animals.
________________________________________________________________________________
QUESTION: Jackie writes “Been reading your informative articles and FAQs. Is there a way I can enter a stock such as BA or an ETF symbols and see them shown as AGL chart with red/green zones, MAs, sector ranking, Green Line etc?”
ANSWER: Yes. Near the bottom of each Daily email, look for: ARE YOUR INVESTMENTS ABOVE THE GREEN LINE?
Please Click on the link (To make the Chart larger, please change the SIZE to Landscape and then Update.)
Good trading and tell your friends!
