
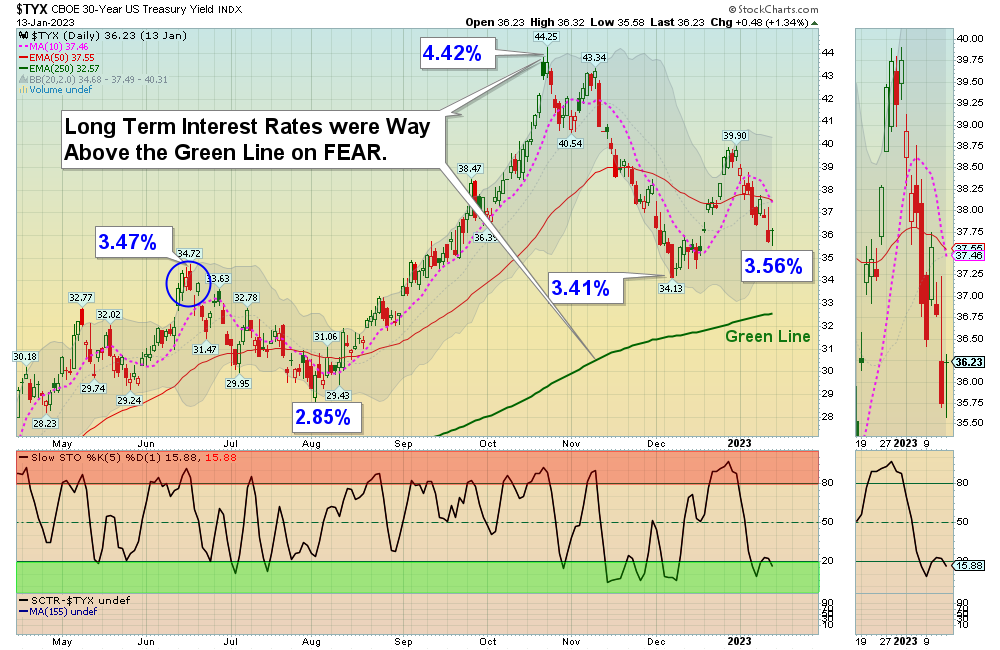
1/16/2023 Markets were higher for the week as long term Interest Rates fell back down near the Green Line. The recent Stock Indices decline did not go down as low as October, which is bullish. Now the S&P 500 Index needs to Close above the 1 year down trend line to bring in more Buyers.
Commodities were weak as many were expecting an economic slow down, but this week the Steel Index was up 7%, Copper up 8%, Rare Earth up 6% and Crude Oil was up 8%. Maybe we don’t need the FED to end their tightening of the Money Supply. Maybe the massive spending by Congress ($1.7 TRILION recently) is the new “sugar high” for the Markets.
There are several Inverse Funds in the Green Zones for Buy Signals soon on the Watch List. Probably a Market pull back next week on higher Interest Rates.
If you continue to Follow the Green Line System, your Money should flow into the Strongest areas and your account value should be able to grow in both Bull and Bear Markets. Follow the MONEY, not the MEDIA..
________________________________________________________________________________________________________________________________________________
Completed Trades this week: (Raising Cash)
ARRAY TECH (ARRY) Target Hit at $22 for a 13.8 % Gain.
First Solar Inc. (FSLR) Target Hit at $162 for a 7.6 % Gain.
Gerdau USA (GGB) Target Hit at $6.10 for an 8.2 % Gain.
Insurance Fund (KIE) Target Hit at $42.50 for a 4.7 % Gain.
Industrial Fund (XLI) Target Hit at $102 for a 3 % Gain.
Pinduodou Inc. (PDD Target Hit at $99 for a 16.2 % Gain.
US Steel Group (X) Target Hit at $27.25 for a 9.1 % Gain.
________________________________________________________________________________________________________________________________________________
For the week the Dow was up 2.01%, the S&P 500 was up 2.69% and the NASDAQ 100 was up 4.43%. Most of the major Indices do not have Relative Strength above 80, so you should currently own the stronger Securities here.
The Inflation Index (CRB) was up 4.19% for the week and is Above the Green Line, indicating Economic Expansion.
Bonds were up 1.49 % for the week, and are Below the Green Line, indicating Economic Expansion.
The US DOLLAR was down 1.64% for the week and is Below the Green Line.
Crude Oil was up 8.26% for the week at $79.86 and GOLD was up 2.78% at $1921.70.
More action this week on the Day Trading Scrolling Charts.
DAY TRADING CHARTS FOR INDICES & LARGE CAPS.
We have not had many intra-day Trade Alert signals lately as the Volume has been too Low with the Buy Signals. These low Volume Buy Signals tend to pop up and quickly fade back down. We like to see High Volume on rallies.
_____________________________________________________________________________________________
MONEY WAVE BUYS SOON:
We are in now in 5 logged Current Positions for the Short & Medium Term. There are 4 investments on the Short Term Watch List.
Be patient and WAIT for Green Zone Buy Signals!
LONG TERM INVESTMENTS: (It is still hard to find many Long Term now because most normal Investments no longer have 80 Relative Strength required.)
Long Term Scrolling Charts (Real Time)
CROX CROX INC. Blew out another 13 % this week. Missed it. AVOID.
ENPH ENPHASE ENERGY INC. Wait for Weekly Money Wave Close > 20 with High Volume.
HRB H&R BLOCK INC. Weekly Money Wave Buy Signal this week, but Volume was not high.
SH INVERSE S&P 500 FUND Buy above $17.71 with High Volume with a 3% Trailing Sell Stop Loss below it.
TWNK HOSTESS BRANDS Buy on the next Daily Money Wave Buy Signal.
UUP US DOLLAR FUND Buy above $28.33 with High Volume with a 3% Trailing Sell Stop Loss below it.
VIPS VIPSHOP HOLDINGS Buy on the next Daily Money Wave Buy Signal.
______________________________________________________________________________________________________
My Trading Dashboard
Swing Trading Scrolling Charts
Day Trading Scrolling Charts
Click for Watch Lists
Click for Current Positions
Click for Closed Positions
Updated Top 100 List Jan 2, 2023
Dividend Growth Portfolio
Updated ETF Sector Rotation System
Dogs of the DOW System
Long Term Strategy for IRAs & 401k Plans
CNN Fear & Greed Index
Scrolling Stage Chart Investing Charts
Alert! Market Risk is Medium (YELLOW). The probability of successful Short Term Trades is better, when the % of stocks above the 50-day avg. is below 20.
Tell your Friends about the Green Line, and Help Animals.
________________________________________________________________________________
QUESTION: Omar writes: “Hello guys. I am new to your website and want to know where I can get analysis for a special stock or commodity?”
ANSWER: HI Omar. Here is a link to Chart your existing investment positions: https://abovethegreenline.com/chart/
Here is another video for using Daily emails: https://youtu.be/Z-0JhIa03xk
And the Rules.
Good trading and tell your friends!
ATGL
