
Golden Cross Trading: How to Confirm the Signal and Avoid False Starts
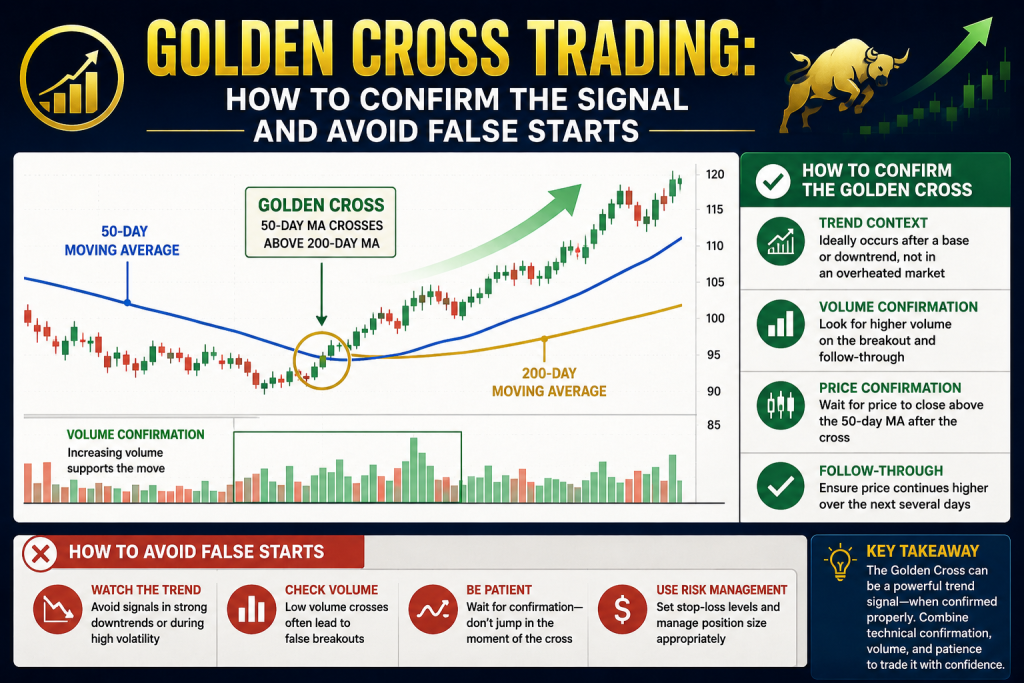
Golden cross trading centers on one of the most closely watched relationships in technical analysis: the moment a shorter-term moving average climbs above a longer-term one. Interpreted on its own, that event tells you a trend has already turned, but it says nothing about whether the move will hold. Confirming the crossover raises the odds […]
Blue Chip Stocks: How to Evaluate Quality Companies Objectively
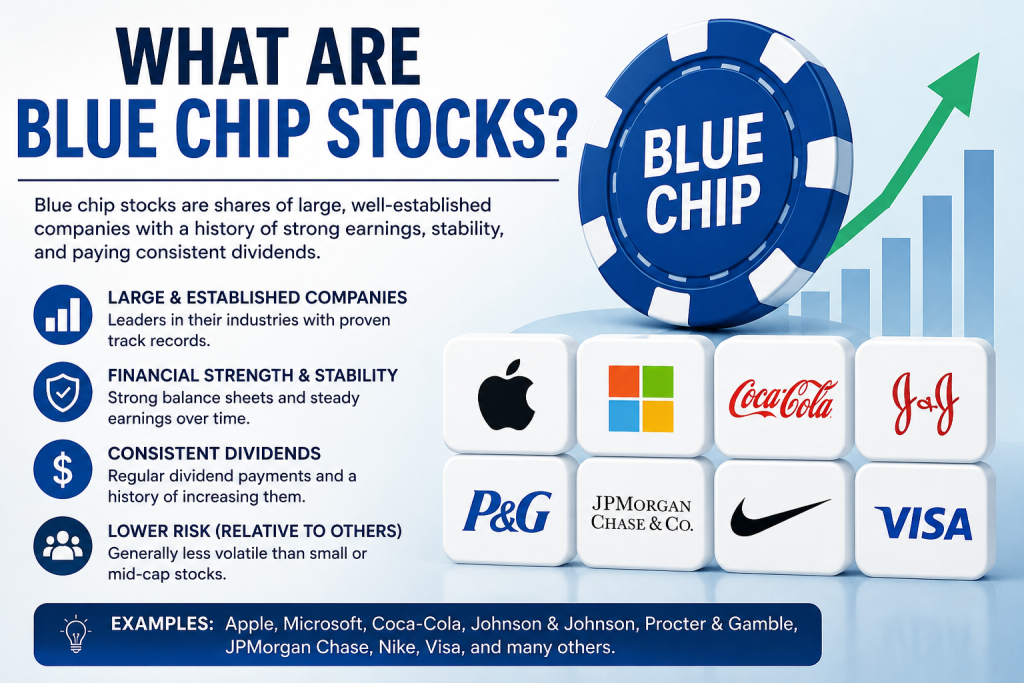
Whether a company qualifies as a blue chip is a conclusion investors can reach on their own by evaluating measurable financial traits rather than relying on its reputation. A blue chip stock is a share in a large, financially established company with a long record of stable earnings and dependable performance. No regulator awards the […]
Trading Alerts: The Complete Guide to Setting Up, Using, and Building a Rules-Based Alert System
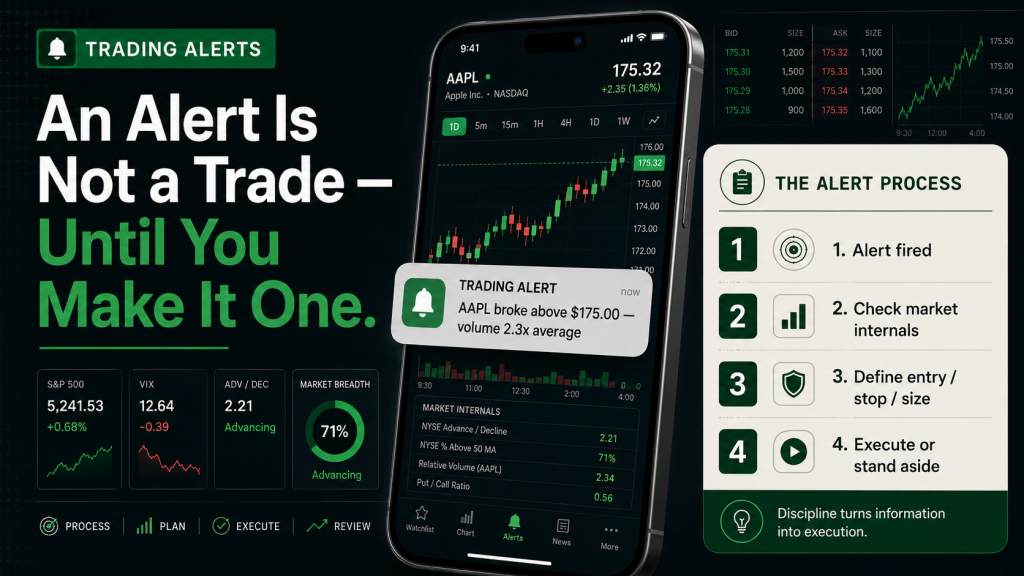
A trading alert is not a trade. It is a notification that a pre-defined condition has been met — price hit a key level, MACD crossed, volume spiked. What happens after the alert fires determines whether it produces a profitable trade or an impulsive entry taken without context, confirmation, or defined risk. The traders who […]
Bear Market Investments: The Complete Playbook for Protecting and Profiting When Markets Fall
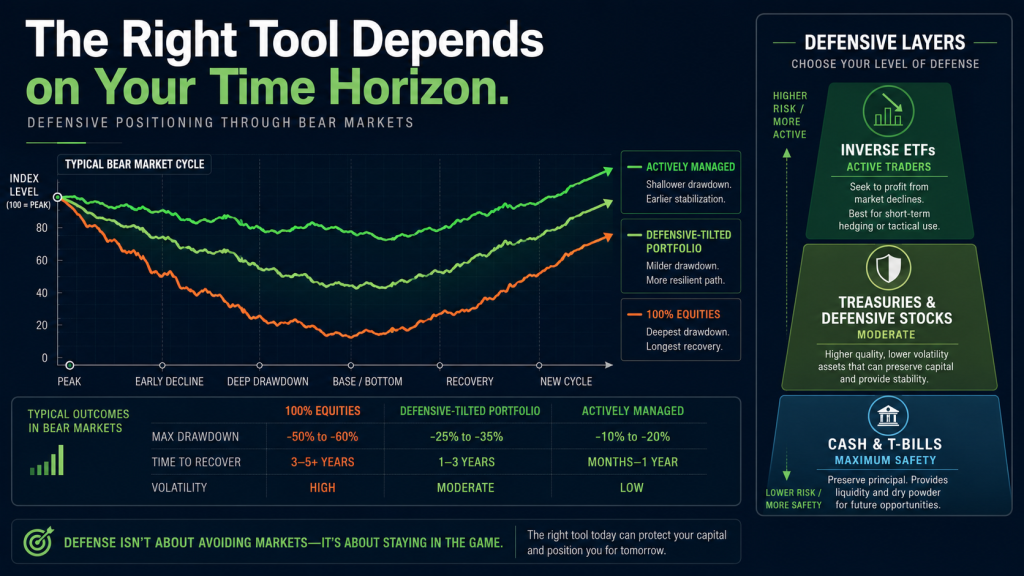
Bear markets are the environment where investment decisions made under pressure determine long-run outcomes far more than any individual stock pick made in a bull market. The investor who panics and sells at the bottom, the investor who does nothing when they should reduce risk, and the investor who holds through a 40% drawdown without […]
Large Cap Stocks: What They Are, Why They Matter, and How to Build a Portfolio Around Them
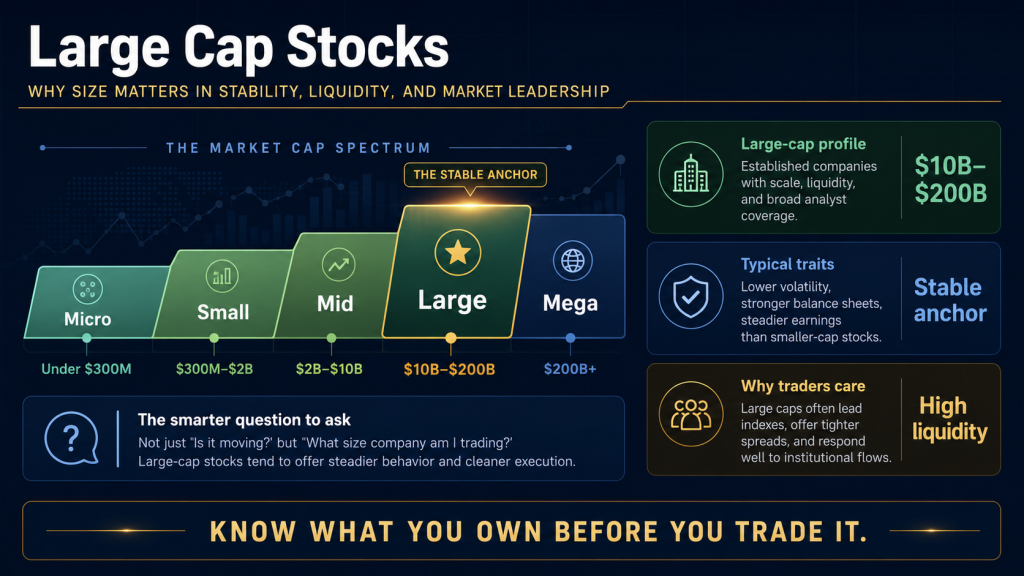
Large cap stocks form the foundation of more investment portfolios than any other asset class. They are the companies inside your 401(k)’s S&P 500 index fund, the names filling the watchlists of professional traders, and the holdings that have compounded wealth for patient investors through every market cycle. Understanding what large cap stocks are, what […]
Moving Average Crossover Strategy: Using Trend Confirmation to Reduce Emotional Trading
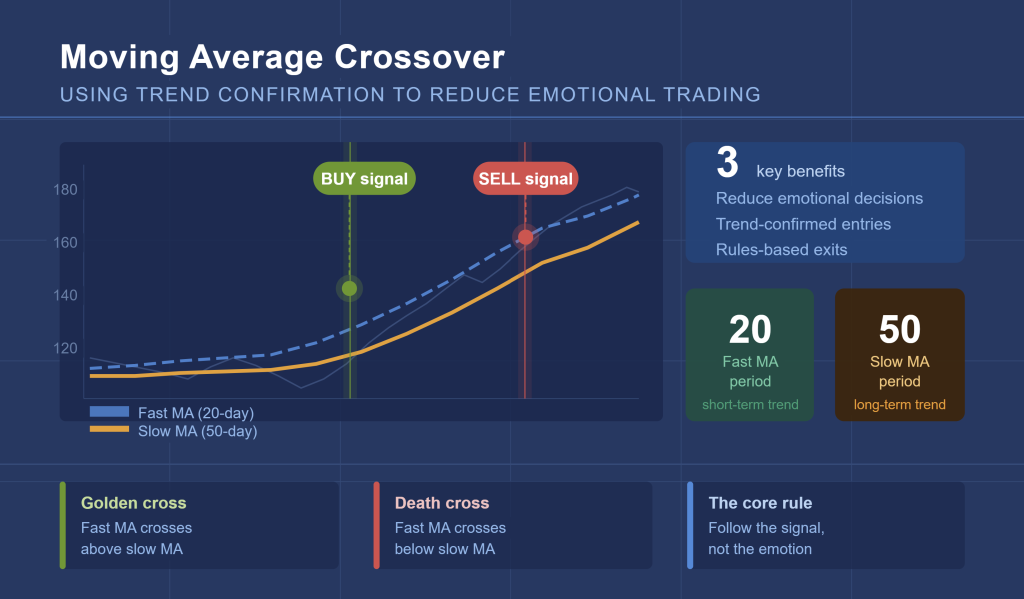
A moving average crossover strategy is a technical analysis method in which two or more moving averages of different timeframes are plotted on a price chart, generating a signal when the shorter-term average crosses above or below the longer-term average. Traders use this approach to identify trend shifts objectively, removing the subjectivity that often accompanies […]
ESPP Explained: The Employee Stock Purchase Plan Most Workers Leave Money On the Table By Ignoring
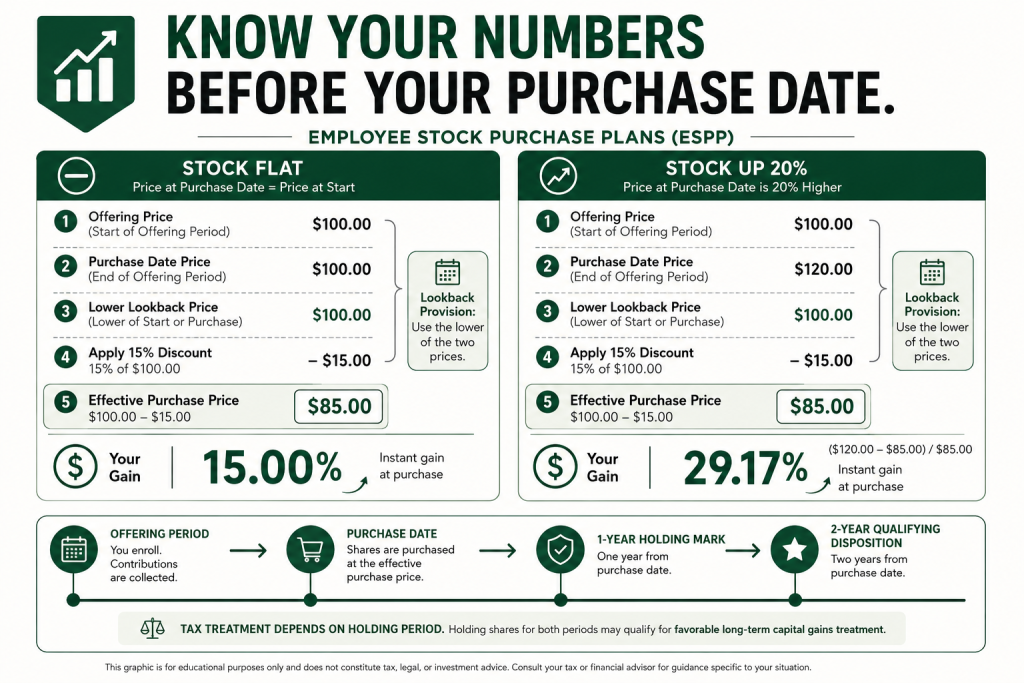
An employee stock purchase plan with a 15% discount and lookback provision is one of the only places in financial markets where the minimum return is guaranteed before you know where the stock goes. Most employees who have access to one don’t fully use it. Most who do participate don’t understand what determines their actual […]
What Is a Bull Market? The Complete Guide Every Trader Needs Before the Next One Starts
Most people learn what a bull market is when they’re already in one — when portfolios are growing, financial media is optimistic, and everyone seems to be winning. The investors who generate real wealth during bull markets are those who understand the structure before it starts. The conditions that birth a bull market. The phases […]
Stock Market Hours: The ONLY Trading Windows That Actually Matter (Most Traders Get This Wrong)

It’s 9:32 AM. Your setup is there. The signal just fired. The chart looks exactly right — and your finger is hovering over the buy button. Should you enter right now, or wait 15 more minutes? If you don’t have a clear, rules-based answer to that question, you’re not alone. Most traders know what the […]
Penny Stocks: How to Identify High-Probability Setups Using Rules-Based Investing
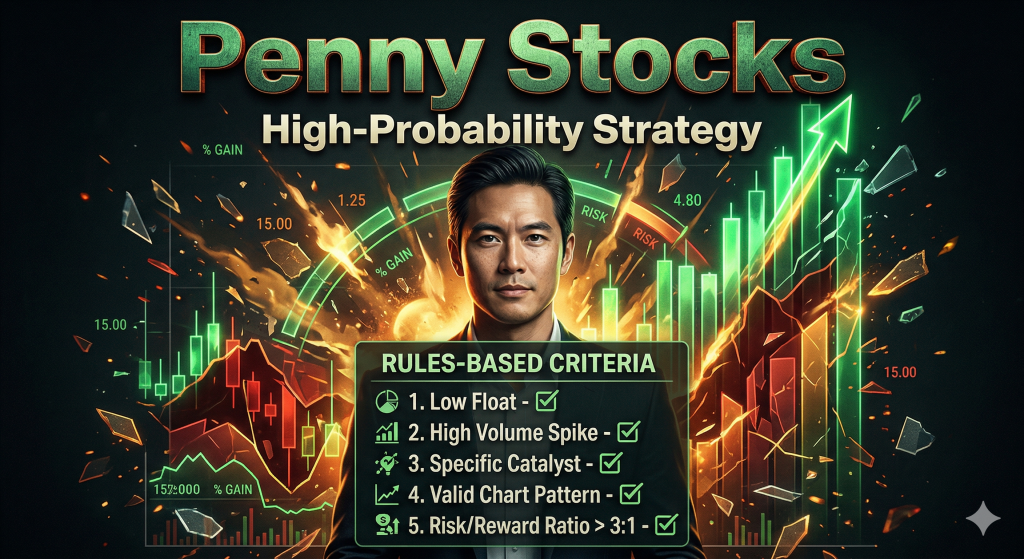
Penny stocks attract attention for one simple reason: the potential for large percentage gains. A stock moving from $1 to $2 represents a 100% return, which creates the illusion of easy profits. However, what most traders quickly learn is that penny stocks are one of the most difficult areas of the market to trade consistently […]