
Margin Call Explained: What Triggers It and How to Avoid One
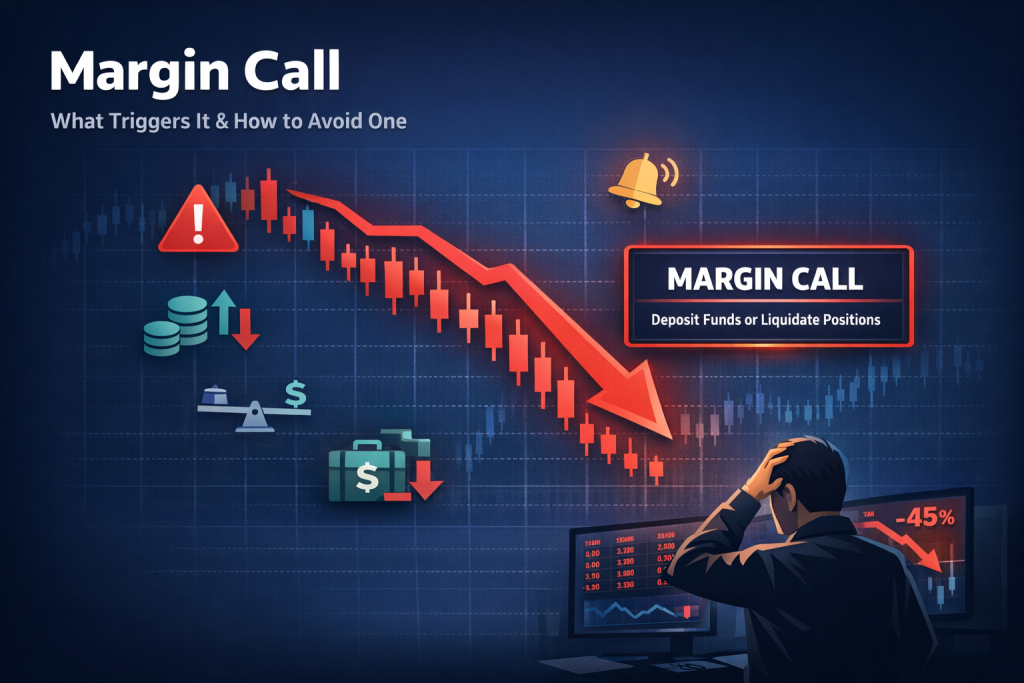
Leverage can be a powerful tool in the stock market. By borrowing money from a brokerage firm, investors can increase the size of their positions and potentially amplify gains. But leverage cuts both ways. When markets move against a leveraged position, losses accumulate faster. If those losses push an investor’s account below a required threshold, […]
AMC Short Squeeze Explained: Timeline, Causes, and Trading Risks
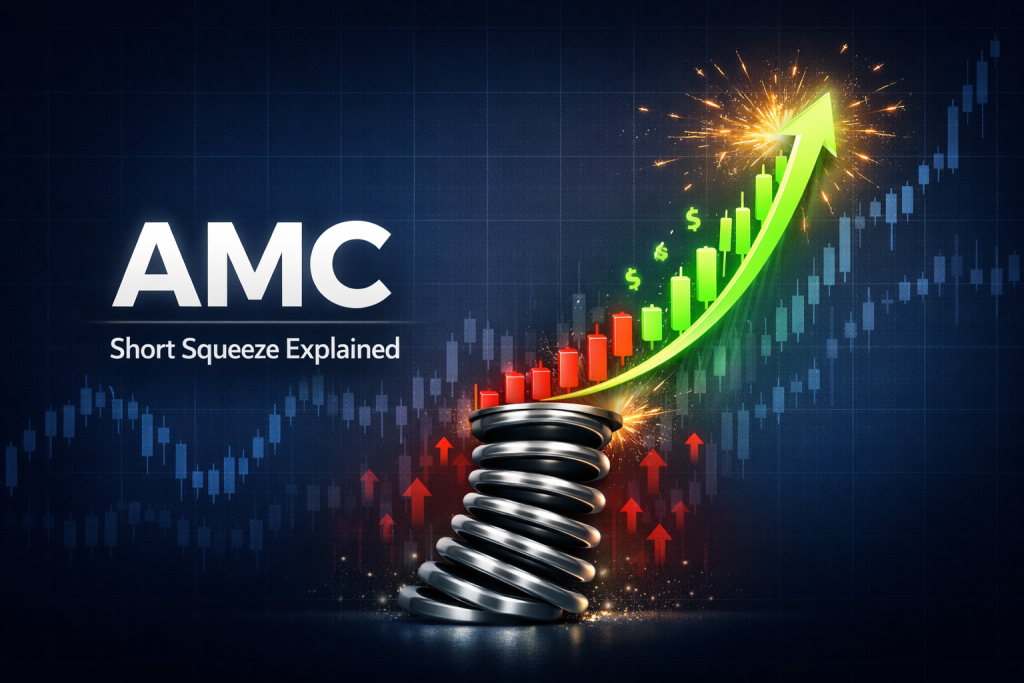
In early 2021, the stock market experienced one of the most unusual trading events in modern financial history. Shares of AMC Entertainment, a struggling movie theater chain, surged dramatically in price as millions of retail investors bought the stock in an effort to trigger a short squeeze. The event captured global attention and became one […]
Volatility Clustering in Financial Markets: Understand Why It Happens
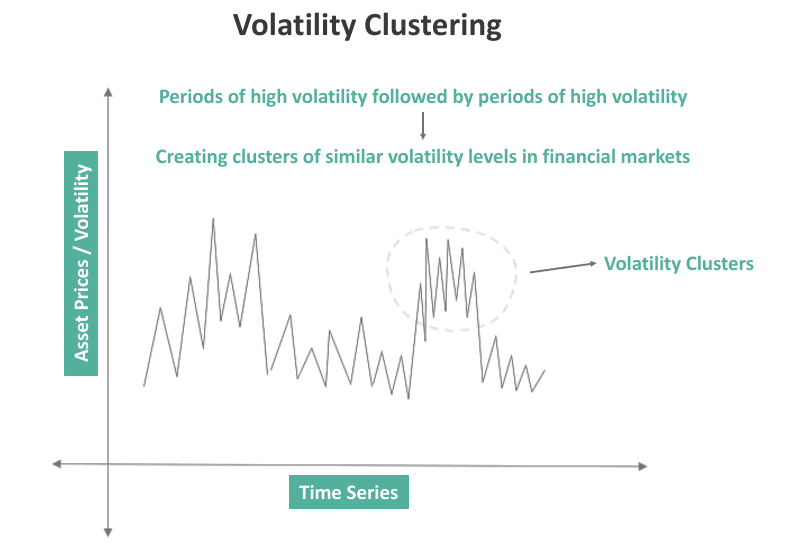
In the study of quantitative finance and market dynamics, few concepts are as foundational yet overlooked by the general investing public as volatility clustering. While many market participants view price fluctuations as random or isolated incidents, empirical data suggests a much more structured reality. Financial markets do not exhibit a constant level of turbulence; rather, […]
Chaikin Money Flow (CMF): How to Use Volume to Spot Real Market Strength
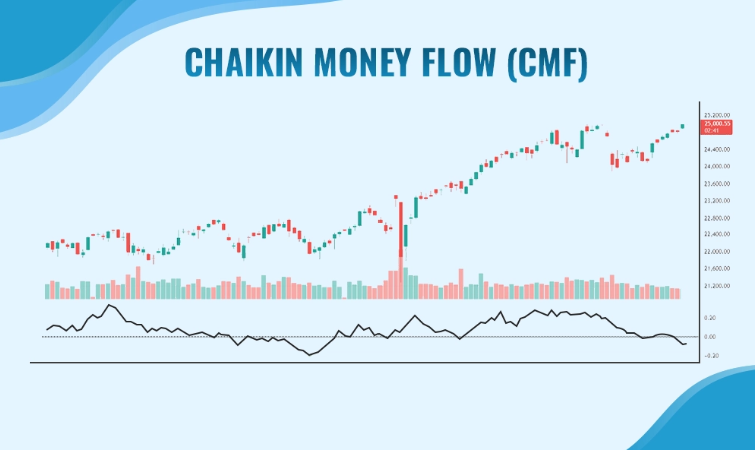
In technical analysis, price action often receives the most attention, yet volume serves as the essential fuel that drives price movement. Without sufficient volume, even the most promising breakout can fail. Among the various tools designed to measure this relationship, the Chaikin Money Flow (CMF) indicator stands out as a premier oscillator for determining the […]
What Is the Bid Ask Spread? How It Impacts Every Trade You Place
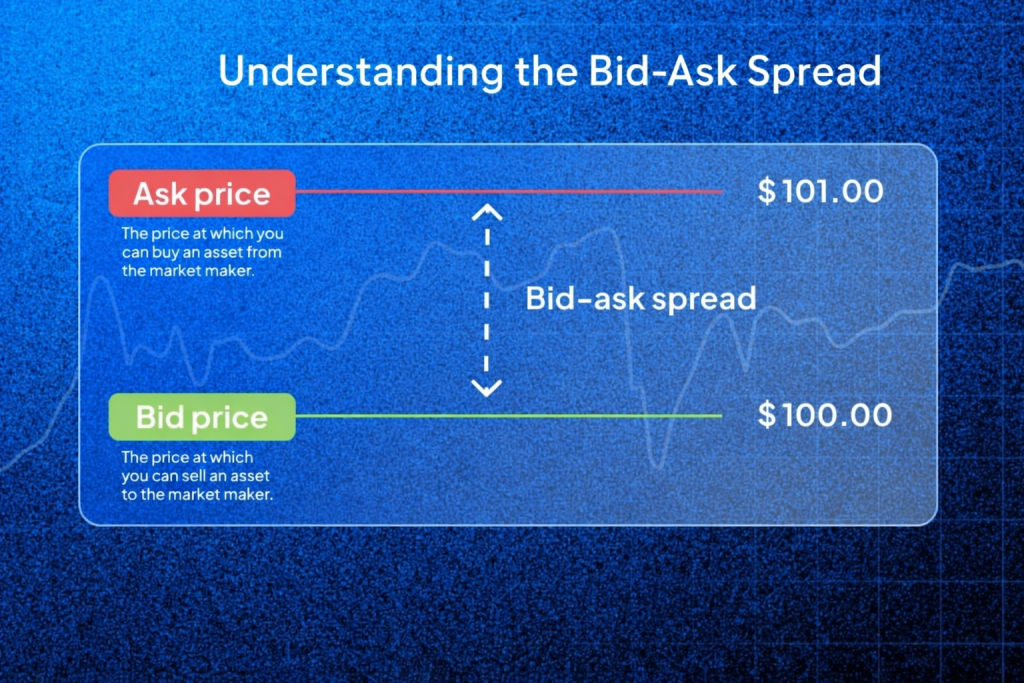
What Is the Bid Ask Spread? How It Impacts Every Trade You Place In the global financial landscape, every transaction is governed by a fundamental mechanism of price discovery. For investors and traders, the most immediate manifestation of this mechanism is the bid-ask spread. While novice market participants often focus solely on the “last price” […]
Intermarket Analysis: How to Use Cross-Asset Signals to Read the Market
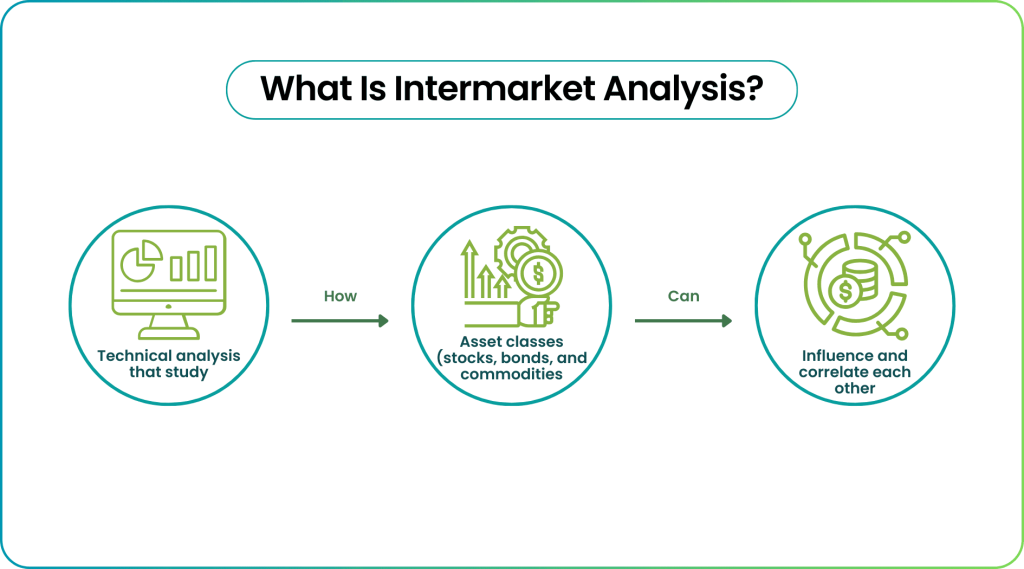
When examining individual stock charts, traders often focus on isolated price movements. However, financial markets operate as interconnected systems where changes in one asset class can signal shifts in another. Intermarket analysis examines relationships across stocks, bonds, commodities, and currencies to provide a comprehensive view of market conditions. By studying how different asset classes interact, […]
24-Hour Trading Explained: How Modern Markets Operate Around the Clock
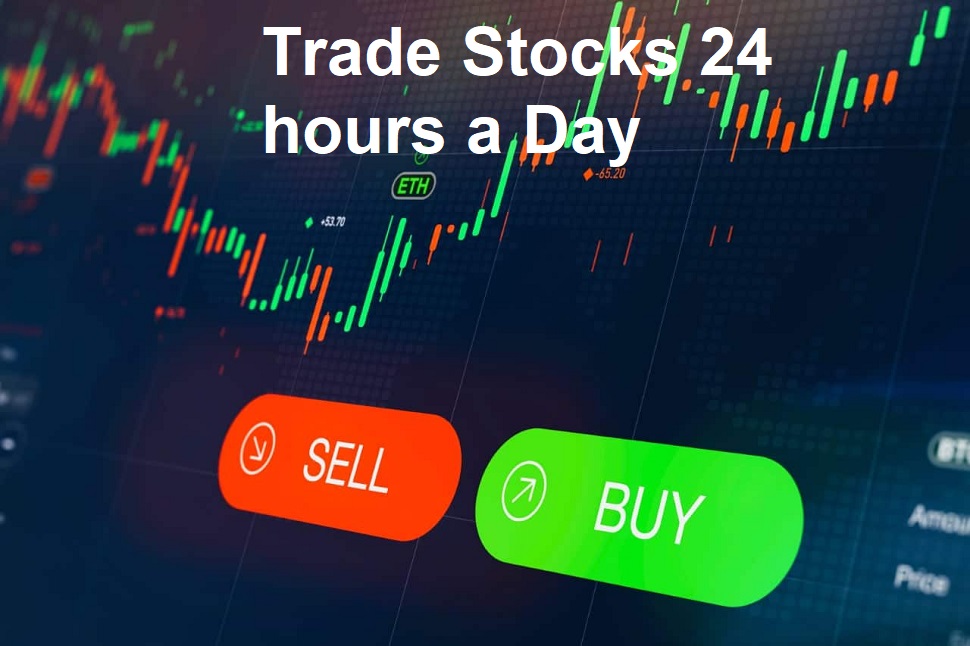
Growing global investor demand for flexible trading access has made 24-hour trading an increasingly important feature in modern capital markets. Technological advances enable continuous market access, while growing international participation drives the need for efficient price discovery across global time zones. This expansion creates new opportunities for institutional investors and day trading professionals to respond […]
What Are Trading Hotkeys and How They Can Transform Your Execution Speed
Execution speed separates profitable trades from missed opportunities in active markets. Trading hotkeys — keyboard shortcuts programmed to execute specific trading actions — address this challenge by streamlining order placement, position management, and chart navigation into instant commands. For those following day trading strategies or scalping approaches, hotkeys function as essential tools that compress decision-making […]
Accumulation Distribution Indicator: How to Read Buying Pressure
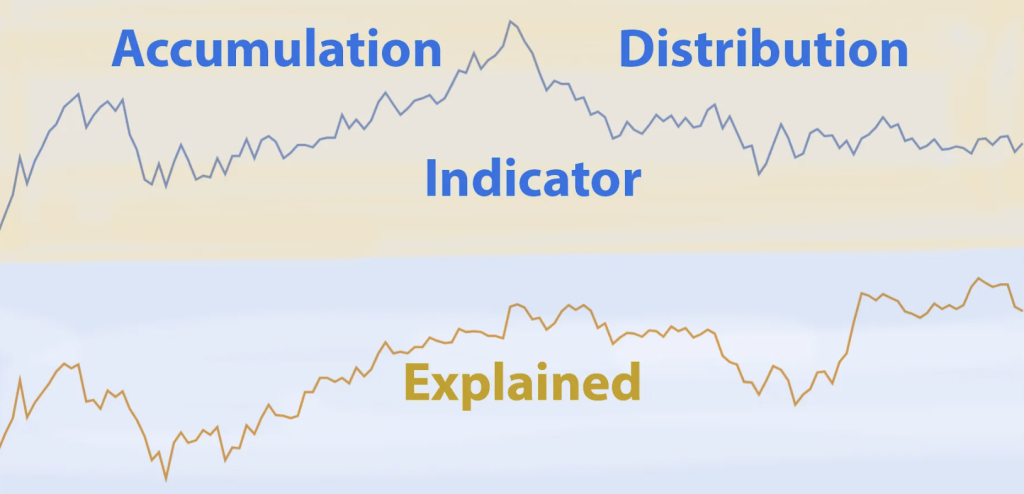
Volume-based indicators play a critical role in technical analysis because they help traders understand how price is moving—not just where it is moving. While price shows direction, volume provides insight into conviction. One of the most widely used tools for this purpose is the accumulation distribution indicator. The accumulation distribution (A/D) indicator measures whether buying […]
Inside Bar Trading Strategy: How to Spot High-Probability Setups
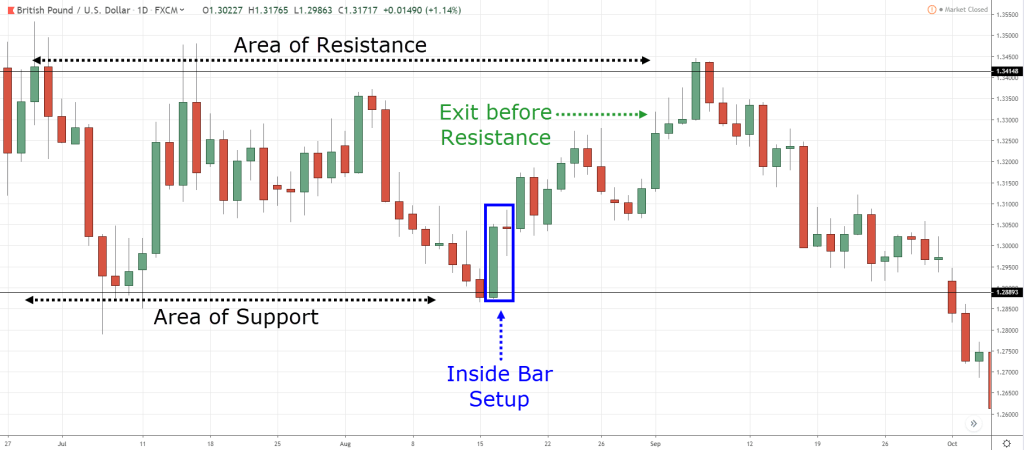
The inside bar trading strategy is one of the simplest price patterns on a chart—and one of the most misunderstood. At a glance, it’s just a smaller candle sitting neatly inside the range of the prior candle. But beneath that simplicity lies valuable information about market compression, indecision, and potential breakout energy. Traders monitor inside […]