
Understanding Breakaway Gaps: Signals of Major Trend Shifts
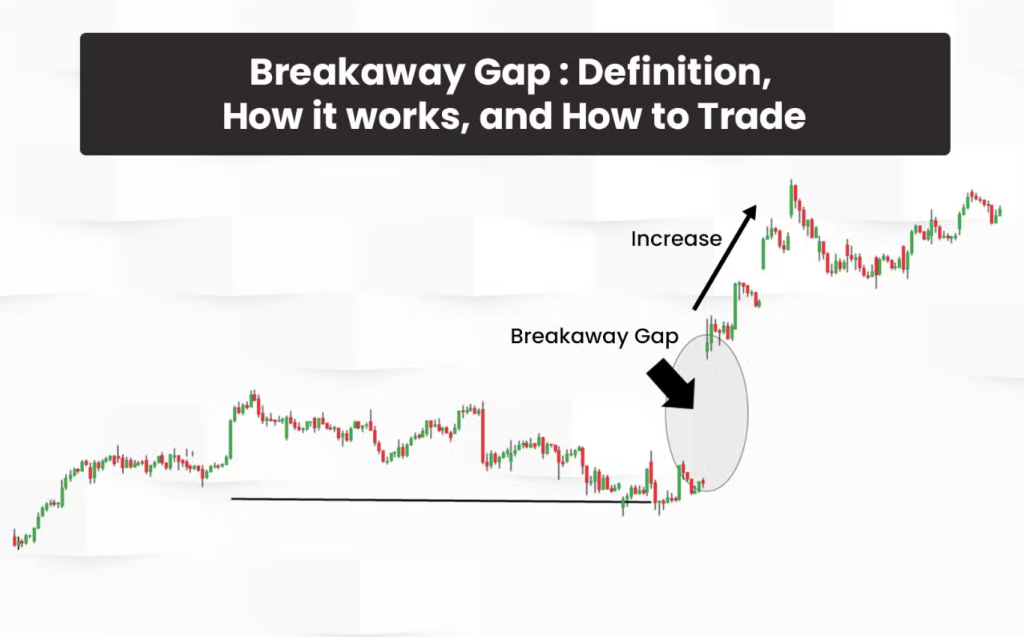
In technical analysis, few price events grab a trader’s attention as quickly as a gap on the chart. When a stock opens significantly above or below the prior day’s range, it immediately signals urgency—buyers or sellers are willing to transact at very different prices than before. Among all gap types, breakaway gaps stand out as […]
Growth Stocks: 3 Strategies to Identify High-Potential Winners

Growth stocks represent shares of companies expected to increase revenue and earnings at an above-average rate compared to other firms in the market. Investors track these equities because they offer the potential for substantial returns over time through capital growth management, driven by expanding market opportunities, technological innovation, and accelerating revenue streams. While these securities […]
Stock Trading Costs: Understanding Their Effect on Returns

Key Stock Trading Fees To Know Stock trading fees fall into two primary categories: explicit costs that appear as line items on account statements and implicit costs that reduce returns without generating visible charges. Each category contains multiple fee types that affect net returns differently depending on trading frequency, position size, and investment strategy. Explicit […]
ARMS Index (TRIN) Explained: Measure Market Breadth Like a Pro
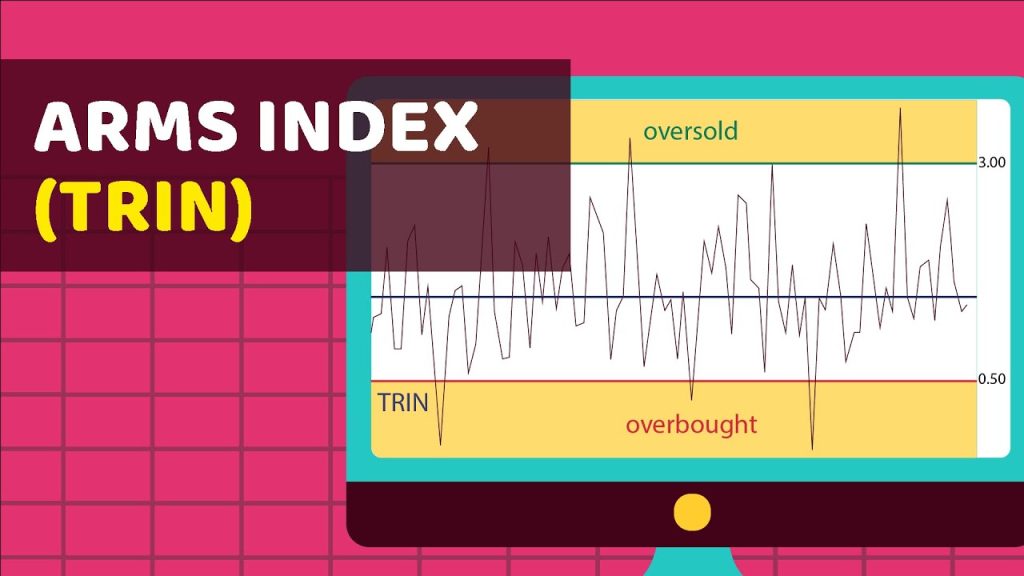
Successful trading requires analyzing the underlying strength of market movements through market breadth, which reveals whether rallies or declines reflect broad participation or narrow activity. The ARMS Index, commonly known as TRIN (Trading Index), serves as a real-time gauge of market sentiment by combining advancing and declining stocks with their corresponding volume data. This metric […]
False Breakouts in Trading: The Signals Most Traders Miss
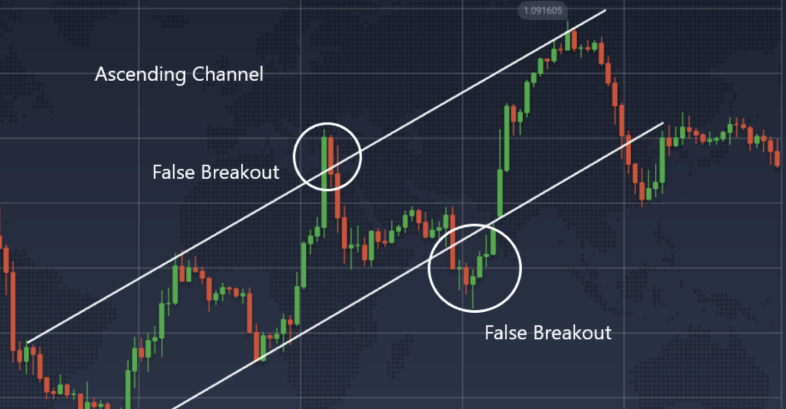
A false breakout represents one of the most frustrating challenges in trading. These deceptive price movements breach critical support or resistance levels, attracting traders into positions, only to reverse and trap them in losing trades. Recognizing these fake moves before committing capital separates consistently profitable traders from those who struggle with unnecessary losses. This article […]
How to Read a Stock Market Heat Map for Better Trading Decisions
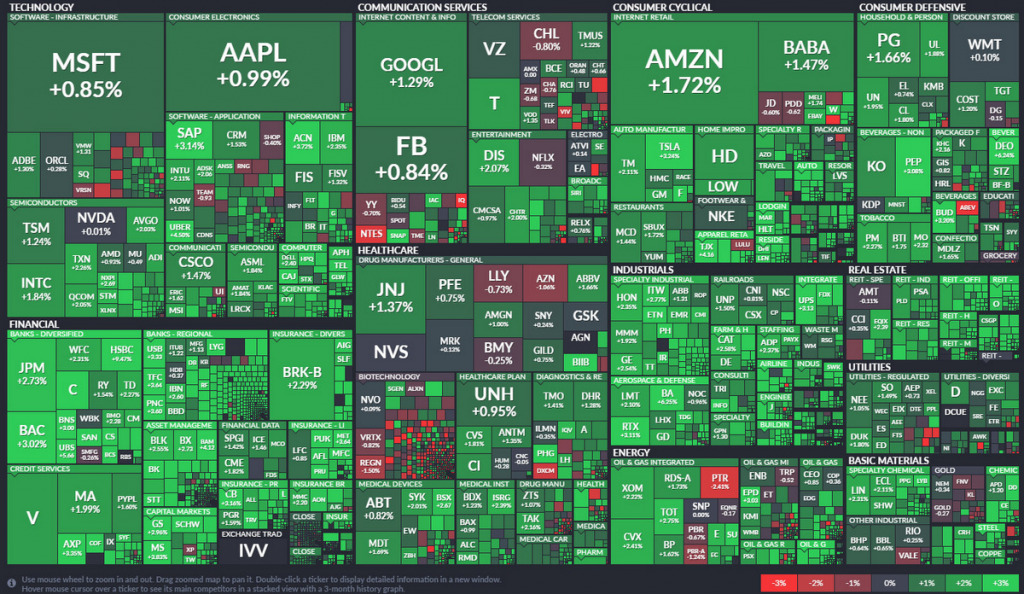
A stock market heat map gives traders a fast, visual overview of the market by displaying real-time performance of individual stocks or sectors using color-coded data. These maps quickly reveal market direction, sector rotation, and capital flow, allowing traders to assess market strength or weakness in seconds. What Stock Market Heat Maps Reveal (and […]
Avoid These Common Stock Trading Mistakes for Better Results
Success in stock trading requires more than market knowledge—it demands discipline, preparation, and awareness of the pitfalls that derail even experienced traders. Common investing mistakes in stock trading often stem from emotional decision-making, inadequate risk controls, and insufficient research. These errors compound over time, eroding capital and undermining confidence. This article examines the most prevalent […]
Identifying Market Exhaustion Signals for Smarter Trading Decisions
Market exhaustion occurs when a prevailing trend—either bullish or bearish—shows signs of losing momentum. Recognizing this transition early is critical for investors and traders aiming to optimize their entry and exit strategies. This article will explore the definition of market exhaustion, common technical signals, and confirmation tools, followed by practical strategies for managing trades near […]
Momentum Stocks: How to Identify and Trade High-Performing Shares
Momentum stocks experience strong price movement in one direction with significant trading volume. This approach capitalizes on stocks with strong recent performance continuing their trajectory, making them attractive for stock trading and swing trading strategies. This article examines how to identify momentum stocks using technical indicators, optimal timing for entries and exits, and methods for […]
What Is Open Interest in Options (and What It Reveals About the Market)
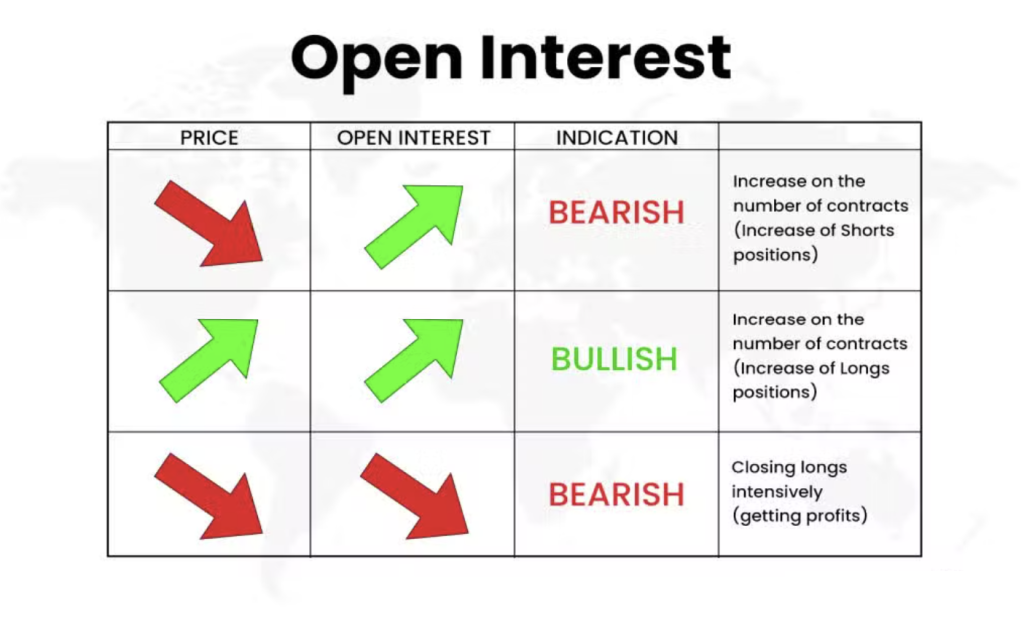
Open interest is one of the most overlooked metrics in options trading, yet it can reveal critical insights into market activity and sentiment. While traders often focus exclusively on price action and volume, open interest provides a distinct perspective on the strength and sustainability of market moves. Understanding the open interest ratio becomes particularly valuable […]