Above the Green Line -01
  • Market Insights
        • Commentary
          • Daily
          • Weekly
        • BUY / SELL SIGNALS
          • Trade Posts
          • Recent Trade Alerts
          • Recent Day Trades
        • BLOGROLL
          • Dividend Growth Blog
          • ETF Sector Blog
          • Dow Dogs
          • TPOW Blog
  • Strategies
        • SWING TRADING
          • Current Positions
          • Watchlists
          • Closed Positions
          • Candidates - TOP 100
          • Specialty Stocks
        • WEEKLY STOCK PICK
          • TPOW Charts
          • TPOW Performance
          • TPOW Strategy Guide
          • TPOW Performance Dashboard
          • Why Weekly Trading Works
        • DAY TRADING
          • Watch List
        • ATGL DASHBOARD
        • ETF STRATEGIES
          • ETF Sector Rotation
          • ETF Sector Portfolio
        • DIVIDEND GROWTH
          • Dividend Growth Portfolio
          • Dividend Calendar
        • DOGS OF THE DOW
          • Dogs of the Dow Portfolio
          • DOW 5 Portfolio
  • Markets
        • US MARKET
          • Commodities
          • Energy
          • Precious Metals
          • Volatility
        • GLOBAL MARKETS
          • Market Indices
          • Economic Calendar
          • FOREX Heat Map
          • FOREX Cross Rates
          • Crypto Currency Market
  • Investing
    • Discord Community
    • Dashboard
  • Resources
        • INVESTING GUIDES
          • Dividend Growth Guide
          • Investment Strategy Framework
          • ETF Investing Handbook
          • Stock Trading Handbook
        • ARTICLES
          • Dividend Growth Model Articles
          • ETF Articles
          • Investment Strategies Articles
          • Market and Economic Insights
          • Stock Trade Articles
          • Stock Reviews
        • TOOLS
          • Stock Scanners
          • Charting Software
          • Brokerage Firms
          • Stocks We Review
        • STOCK CHARTS
          • Key Components
          • Reading Charts
          • Drawing Stock Charts
          • Identifying Trends
  • About
    • Contact Us
    • How to Win
    • #1 At Stockcharts
    • Disclaimer
    • FAQ
  • Log In
  • Subscribe

March 12, 2026

Margin Call Explained: What Triggers It and How to Avoid One

Margin Call Explained

Leverage can be a powerful tool in the stock market. By borrowing money from a brokerage firm, investors can increase the size of their positions and potentially amplify gains. But leverage cuts both ways. When markets move against a leveraged … [Read more...]

March 12, 2026

AMC Short Squeeze Explained: Timeline, Causes, and Trading Risks

AMC Short Squeeze Explained: Timeline, Causes, and Trading Risks

In early 2021, the stock market experienced one of the most unusual trading events in modern financial history. Shares of AMC Entertainment, a struggling movie theater chain, surged dramatically in price as millions of retail investors bought the … [Read more...]

February 2, 2026

Volatility Clustering in Financial Markets: Understand Why It Happens

Volatility Clustering in Financial Markets

In the study of quantitative finance and market dynamics, few concepts are as foundational yet overlooked by the general investing public as volatility clustering. While many market participants view price fluctuations as random or isolated … [Read more...]

February 2, 2026

Chaikin Money Flow (CMF): How to Use Volume to Spot Real Market Strength

Chaikin Money Flow (CMF)

In technical analysis, price action often receives the most attention, yet volume serves as the essential fuel that drives price movement. Without sufficient volume, even the most promising breakout can fail. Among the various tools designed to … [Read more...]

February 2, 2026

What Is the Bid Ask Spread? How It Impacts Every Trade You Place

Bid Ask Spread

What Is the Bid Ask Spread? How It Impacts Every Trade You Place In the global financial landscape, every transaction is governed by a fundamental mechanism of price discovery. For investors and traders, the most immediate manifestation of this … [Read more...]

February 1, 2026

Intermarket Analysis: How to Use Cross-Asset Signals to Read the Market

Intermarket Analysis

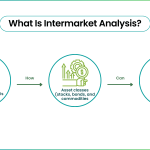
When examining individual stock charts, traders often focus on isolated price movements. However, financial markets operate as interconnected systems where changes in one asset class can signal shifts in another. Intermarket analysis examines … [Read more...]

February 1, 2026

24-Hour Trading Explained: How Modern Markets Operate Around the Clock

24-Hour Trading

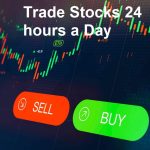
Growing global investor demand for flexible trading access has made 24-hour trading an increasingly important feature in modern capital markets. Technological advances enable continuous market access, while growing international participation drives … [Read more...]

February 1, 2026

What Are Trading Hotkeys and How They Can Transform Your Execution Speed

Trading Hotkeys

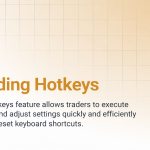
Execution speed separates profitable trades from missed opportunities in active markets. Trading hotkeys — keyboard shortcuts programmed to execute specific trading actions — address this challenge by streamlining order placement, position … [Read more...]

December 25, 2025

Accumulation Distribution Indicator: How to Read Buying Pressure

Accumulation Distribution

Volume-based indicators play a critical role in technical analysis because they help traders understand how price is moving—not just where it is moving. While price shows direction, volume provides insight into conviction. One of the most widely used … [Read more...]

December 25, 2025

Inside Bar Trading Strategy: How to Spot High-Probability Setups

Inside Bar Trading Strategy

The inside bar trading strategy is one of the simplest price patterns on a chart—and one of the most misunderstood. At a glance, it’s just a smaller candle sitting neatly inside the range of the prior candle. But beneath that simplicity lies valuable … [Read more...]

  • 1
  • 2
  • 3
  • …
  • 14
  • Next Page »

Subscribe to Our Newsletter

AGL Logo

Get our eBook Now!

Candlestick - A Swing Traders Friend

We don’t spam! Read our privacy policy for more info.

You’ve been successfully subscribed to our newsletter!

Voted #1 at Stock Charts

SH Chart
Inverse S&P 500 Fund (SH) will have a Money Wave Buy today.

Help Us Help Animals

Help Us Help Animals

Recent Comments

  • DBC ETF Guide: Is This Commodity Fund Worth the Risk? on ETF Asset Allocation: Choosing the Right Mix for Your Portfolio
  • ATGL Weekly Money Flow - 2026-03-08 on ATGL Top Pick of the Week! Feb 22, 2026
  • XBI ETF Explained: Is This Biotech Fund a Smart Buy in 2026? on What Is an Expense Ratio and What Would Be a Good One?
  • XBI ETF Explained: Is This Biotech Fund a Smart Buy in 2026? on What Are Sector ETFs and How Do You Invest in Them?
  • XBI ETF Explained: Is This Biotech Fund a Smart Buy in 2026? on ETF vs Index Fund Comparison Guide for Smarter Investing

Become a Green Liner!

Help me make more Money in the Stock Market.

ON ATGL

  • DashBoard
  • Weekly Commentary
  • Daily Buy / Sell Signals
  • Day Trade Setup
  • Trading Rooms

Design & Develop By Pixelvect

STRATEGIES

  • Swing Trading
  • ATGL Pick of the Week
  • Dividend Growth
  • ETF Sector Rotation
  • Dogs of the Dow

HELP

  • ATGL Trading Rules
  • FAQ
  • Account Maintenance
  • Contact US
  • Join

FOLLOW US

Instagram Linkedin Twitter Facebook

© COPYRIGHT 2024 · ABOVETHEGREENLINE.COM · ALL RIGHTS RESERVED · PRIVACY · TERMS · CONTACT · WATCHLIST · CURRENT