
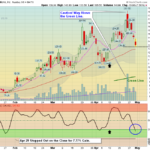
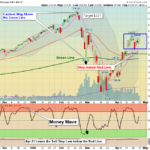
Markets were lower today as the S&P 500 stalled after returning back up to the Green Line. Several Leaders are quickly back down in the Green Zones for Money Wave Buy Signals soon. The Watch List below has grown, so probably a bounce … [Read more...]
Money Wave Alert! Apr 30, 2020
Money Wave Alert! Apr 29, 2020
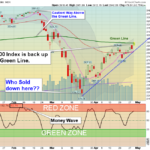
Markets were again higher today as the S&P 500 finally returned back up to the Green Line. Remember how in March the Media scared many investors into Selling on FEAR, and Way Below the Green Line? Much of the Fear is gone now, which … [Read more...]
Money Wave Alert! Apr 28, 2020
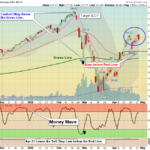
WE ARE CURRENTLY EXPERIENCING SERVER PROBLEMS. THANK YOU FOR YOUR PATIENCE. Markets were higher on the opening today as the S&P 500 was able to exceed the mid April High of 2879 for this rally to continue. Later today much of the … [Read more...]
Money Wave Alert! Apr 27, 2020
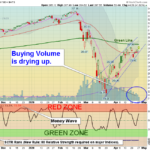
Markets were higher again today on more low Volume. The S&P 500 is trying to exceed the mid April High of 2879 for this rally to continue. Big Battle going on here, as Markets have had a big rally off the March Lows, without much … [Read more...]
Money Wave Alert! Apr 24, 2020
Markets were higher again today on low Volume. The S&P 500 needs to exceed last week's High of 2879 for this rally to continue. Some of the Leaders were able to make Higher Highs, but none of the major Indices. The sideways action this … [Read more...]
- « Previous Page
- 1
- …
- 303
- 304
- 305
- 306
- 307
- …
- 491
- Next Page »