Above the Green Line -01
  • Market Insights
        • Commentary
          • Daily
          • Weekly
        • BUY / SELL SIGNALS
          • Trade Posts
          • Recent Trade Alerts
          • Recent Day Trades
        • BLOGROLL
          • Dividend Growth Blog
          • ETF Sector Blog
          • Dow Dogs
          • TPOW Blog
  • Strategies
        • SWING TRADING
          • Current Positions
          • Watchlists
          • Closed Positions
          • Candidates - TOP 100
          • Specialty Stocks
        • WEEKLY STOCK PICK
          • TPOW Charts
          • TPOW Performance
          • TPOW Strategy Guide
          • TPOW Performance Dashboard
        • DAY TRADING
          • Watch List
        • ATGL DASHBOARD
        • ETF STRATEGIES
          • ETF Sector Rotation
          • ETF Sector Portfolio
        • DIVIDEND GROWTH
          • Dividend Growth Portfolio
          • Dividend Calendar
        • DOGS OF THE DOW
          • Dogs of the Dow Portfolio
          • DOW 5 Portfolio
  • Markets
        • US MARKET
          • Commodities
          • Energy
          • Precious Metals
          • Volatility
        • GLOBAL MARKETS
          • Market Indices
          • Economic Calendar
          • FOREX Heat Map
          • FOREX Cross Rates
          • Crypto Currency Market
  • Investing
    • Discord Community
    • Dashboard
  • Resources
        • ARTICLES
          • Dividend Growth Model Articles
          • ETF Articles
          • Investment Strategies Articles
          • Market and Economic Insights
          • Stock Trade Articles
          • Stock Reviews
        • TOOLS
          • Stock Scanners
          • Charting Software
          • Brokerage Firms
        • STOCK CHARTS
          • Key Components
          • Reading Charts
          • Drawing Stock Charts
          • Identifying Trends
        • RETIREMENT PLANNING
  • About
    • Contact Us
    • How to Win
    • #1 At Stockcharts
    • Disclaimer
    • FAQ
  • Log In
  • Subscribe

April 27, 2020

Money Wave Alert! Apr 27, 2020

SPY Chart
Buying Volume is drying up lately.


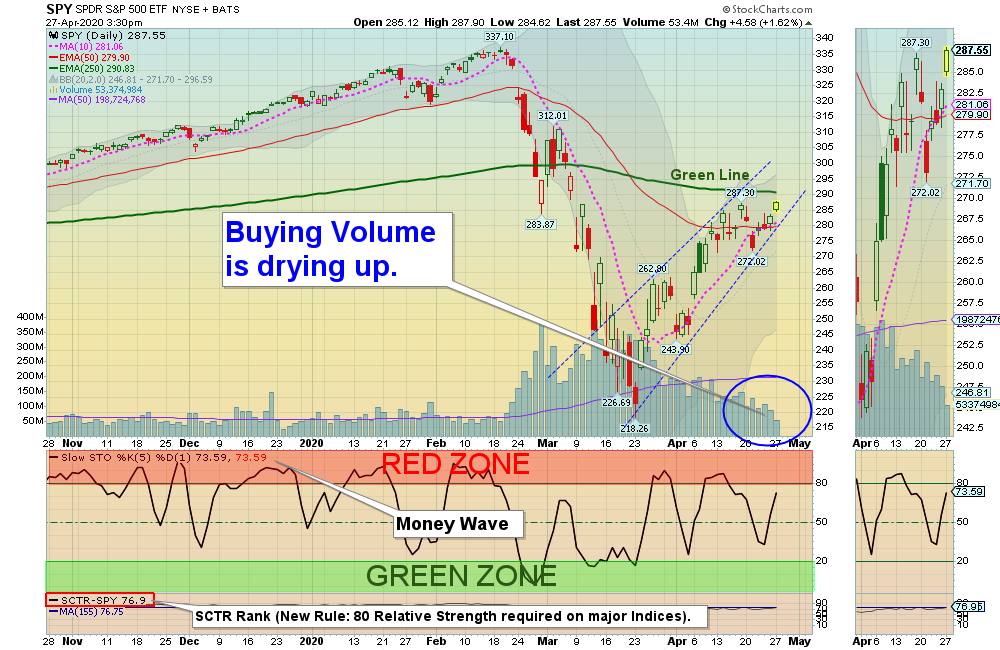
Markets were higher again today on more low Volume. The S&P 500 is trying to exceed the mid April High of 2879 for this rally to continue. Big Battle going on here, as Markets have had a big rally off the March Lows, without much Selling yet. Low Volume is a concern for Bulls.

Some of the Leaders were able to make Higher Highs, but not many good trades recently as the Markets are too over-bought. The sideways action this week normally means a bigger move is coming… We will have to wait to be told which direction.

If the Markets cannot get above the Green Lines, then the weaker Indices like the Small Caps, Transports & NYSE could easily go back down once more. This rally from the Lows could be an A-B-C up on Elliott Wave count, and then maybe back down again. All of the major Indices except the NASDAQ 100 are still Below the Green Lines, which is Bearish.

NEW SUBSCRIBERS: Be patient and WAIT for the S&P 500 Index and the Leaders to come back down and return to the Green Zones for more Buy Signals soon (it does not take that long).


CHECK OUT THE DAY TRADE WATCH LIST.


Bonds  were down again today.  

Crude Oil was down $3.87 today at $13.08.


The Following Investments will probably have a Money Wave Buy Signal soon. (Slow Stochastic Closing > 20) on today’s Close.

BUYS TODAY    4/27/2020    


VIPS     VIPSHOP HOLDINGS LTD.      Money Wave Buy today.  Target is $19.00.  EXIT if it is going to Close below $15.71.


Money Wave Buys Signals Soon (Short Term):   (Best to Buy these when the S&P 500 is also in the Green Zone.)    


“JUMP START” Candidates:  (Buy Signal should be very soon… Click on the Jump Start link for more info.)   

EQT     EQT CORP.  

_______________________________________________________________________________________________________________________________________________   

BABA     ALIBABA GROUP    

LLNW     LIMELIGHT NETWORKS INC.     Buy if it Closes above $5.63 on High Volume

ZS     ZSCALER INC.      Money Wave must Close in the Green Zone.     


Please be patient and wait for Money Wave Buy Signals.  We will email you when they are ready. Click on Watch List.

Emotions are very high now, so please do not Buy unless you are VERY NIMBLE.

The Leaders are Way Above the Green Lines (all Investments eventually return to their Green Lines).

___________________________________________________________________________________________________

SELLS TODAY   


RWM     INVERSE SMALL CAP FUND     LOWER the Sell Stop Loss below the Green Line of $41.34 until it bottoms. The Money Wave is back down in the Green Zone with 90 Relative Strength.


ATHX          ATHERSYS INC.     EXIT if it is going to Close below your Buy Price, or $2.63.  This trade was not logged.   

IAU     GOLD FUND    EXIT if it is going to Close below your Buy Price, or $16.40.  This trade was not logged.   

VXX     VOLATILITY INDEX    EXIT if it is going to Close below your Buy Price, or $38.81.  This trade was not logged.   


Click for   PORTFOLIO  (Open Positions) and adjust your Sell Stops. 

Click for  CLOSED POSITIONS, 

NEW ETF SECTOR ROTATION SYSTEM   (LINK)

NEW! TOP 100 LIST Updated Mar 31, 2020


Many like to Buy the day before, near the Close, if the Money Wave is going to create a Buy Signal (Closing > 20 and out of the Green Zone).

Don’t Buy if the Investment has already popped up too much. Money Wave Buys are usually good for a 3-6 %  move in a few days.

We will “Not Log” trades if the Reward/Risk is not at least 2:1.

Related Post

– Money Wave Alert! Apr 24, 2020

Subscribe to Our Newsletter

AGL Logo

Get our eBook Now!

Candlestick - A Swing Traders Friend

We don’t spam! Read our privacy policy for more info.

You’ve been successfully subscribed to our newsletter!

Voted #1 at Stock Charts

SH Chart
Inverse S&P 500 Fund (SH) will have a Money Wave Buy today.

Help Us Help Animals

Help Us Help Animals

Recent Comments

  • Market Breadth Indicators: A Trader’s Guide to Early Trend Detection on Backtesting: Definition and How a Trading Strategy Backtest Works
  • Island Reversal Pattern: Definition and Formation Explained on Double Top Pattern: How to Identify and Trade This Reversal Signal
  • Channel Pattern Guide: What It Is and Why It Matters on A Guide to Forecasting Using Moving Averages
  • What Is a Broadening Bottom Chart Pattern? Full Guide on Bull vs. Bear Market: An Investor’s Guide to Market Phases
  • ATGL Weekly Money Flow - 2025-05-11 on ATGL Top Pick of the Week! Apr 6, 2025

Become a Green Liner!

Help me make more Money in the Stock Market.

ON ATGL

  • DashBoard
  • Weekly Commentary
  • Daily Buy / Sell Signals
  • Day Trade Setup
  • Trading Rooms

Design & Develop By Pixelvect

STRATEGIES

  • Swing Trading
  • ATGL Pick of the Week
  • Dividend Growth
  • ETF Sector Rotation
  • Dogs of the Dow

HELP

  • ATGL Trading Rules
  • FAQ
  • Account Maintenance
  • Contact US
  • Join

FOLLOW US

Instagram Linkedin Twitter Facebook

© COPYRIGHT 2024 · ABOVETHEGREENLINE.COM · ALL RIGHTS RESERVED · PRIVACY · TERMS · CONTACT · WATCHLIST · CURRENT