Above the Green Line -01
  • Market Insights
        • Commentary
          • Daily
          • Weekly
        • BUY / SELL SIGNALS
          • Trade Posts
          • Recent Trade Alerts
          • Recent Day Trades
        • BLOGROLL
          • Dividend Growth Blog
          • ETF Sector Blog
          • Dow Dogs
          • TPOW Blog
  • Strategies
        • SWING TRADING
          • Current Positions
          • Watchlists
          • Closed Positions
          • Candidates - TOP 100
          • Specialty Stocks
        • WEEKLY STOCK PICK
          • TPOW Charts
          • TPOW Performance
          • TPOW Strategy Guide
          • TPOW Performance Dashboard
          • Why Weekly Trading Works
        • DAY TRADING
          • Watch List
        • ATGL DASHBOARD
        • ETF STRATEGIES
          • ETF Sector Rotation
          • ETF Sector Portfolio
        • DIVIDEND GROWTH
          • Dividend Growth Portfolio
          • Dividend Calendar
        • DOGS OF THE DOW
          • Dogs of the Dow Portfolio
          • DOW 5 Portfolio
  • Markets
        • US MARKET
          • Commodities
          • Energy
          • Precious Metals
          • Volatility
        • GLOBAL MARKETS
          • Market Indices
          • Economic Calendar
          • FOREX Heat Map
          • FOREX Cross Rates
          • Crypto Currency Market
  • Investing
    • Discord Community
    • Dashboard
  • Resources
        • INVESTING GUIDES
          • Dividend Growth Guide
          • Investment Strategy Framework
          • ETF Investing Handbook
          • Stock Trading Handbook
        • ARTICLES
          • Dividend Growth Model Articles
          • ETF Articles
          • Investment Strategies Articles
          • Market and Economic Insights
          • Stock Trade Articles
          • Stock Reviews
        • TOOLS
          • Stock Scanners
          • Charting Software
          • Brokerage Firms
          • Stocks We Review
        • STOCK CHARTS
          • Key Components
          • Reading Charts
          • Drawing Stock Charts
          • Identifying Trends
  • About
    • Contact Us
    • How to Win
    • #1 At Stockcharts
    • Disclaimer
    • FAQ
  • Log In
  • Subscribe

Buy / Sell Signals

June 8, 2020

Money Wave Alert! Jun 8, 2020

QQQ Chart

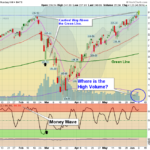
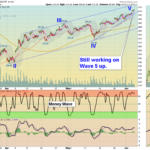
  Markets were up again today as the S&P 500 Index made it up to the 3215 Target for Wave 5 up. The NASDAQ 100 was able to make New Highs but there is no High Volume wanted on the Break-Out. Lots of big pops Friday and today on the weaker … [Read more...]

June 5, 2020

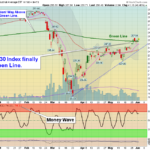
Money Wave Alert! Jun 5, 2020

CNN Fear Chart

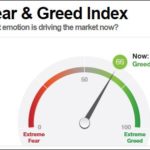
  Markets "Gapped Up" today on stampede Buying as the S&P 500 Index is near the 3215 Target for Wave 5 up. The NASDAQ 100 was able to make New Highs on average Volume. The Indices are currently very over-bought, and the CNN Fear & … [Read more...]

June 4, 2020

Money Wave Alert! Jun 4, 2020

QQQ Chart

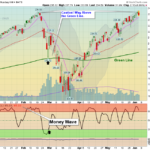
Markets were down slightly today as the Indices became over-bought. Most of the Leaders are up in the Red Zones (probably too late to Buy for the Short Term) and a few Leaders were 100% Above their Green Lines! When Investments like the Leaders are … [Read more...]

June 3, 2020

Money Wave Alert! Jun 3, 2020

SPX 60 Chart

Markets were up again today as the Herd is getting back in the Markets on Good News after a 40 % rally. Several Leaders are now 100% Above their Green Lines! This is how Tammy loses Money, as she Sells on FEAR (March Lows from Virus) and Buys on Good … [Read more...]

June 2, 2020

Money Wave Alert! Jun 2, 2020

DIA Chart

  Markets were up again today as the S&P 500 Index went slightly above last Thursday's Highs. Most of the Leaders are so extended that they are not moving much lately. The NASDAQ 100 Index was mixed today. The S&P 500 Index is holding … [Read more...]

  • « Previous Page
  • 1
  • …
  • 304
  • 305
  • 306
  • 307
  • 308
  • …
  • 497
  • Next Page »
FREE TRADE PICK

Get This Week's
Top Pick — Free

One rules-based swing trade signal. No credit card. No obligation.

  • Buy price, target & exit rules included
  • Based on relative strength & trend signals
  • Recent picks: +17.1%, +10.7%, +6.2%

This week's Top Pick drops Sunday afternoon

Enter your email to get it delivered to your inbox

SEND MY FREE PICK

We don't spam! Read our privacy policy for more info.

Subscribe to Our Newsletter

AGL Logo

Get our eBook Now!

Candlestick - A Swing Traders Friend

We don’t spam! Read our privacy policy for more info.

You’ve been successfully subscribed to our newsletter!

Voted #1 at Stock Charts

SH Chart
Inverse S&P 500 Fund (SH) will have a Money Wave Buy today.

Help Us Help Animals

Help Us Help Animals

Recent Comments

  • ATGL Weekly Money Flow - 2026-03-08 on ATGL Top Pick of the Week! Feb 22, 2026
  • XBI ETF Explained: Is This Biotech Fund a Smart Buy in 2026? on What Is an Expense Ratio and What Would Be a Good One?
  • XBI ETF Explained: Is This Biotech Fund a Smart Buy in 2026? on What Are Sector ETFs and How Do You Invest in Them?
  • XBI ETF Explained: Is This Biotech Fund a Smart Buy in 2026? on ETF vs Index Fund Comparison Guide for Smarter Investing
  • How to Use Net Present Value (NPV) for Dividend Stocks on How To Analyze Stocks With the Dividend Discount Model

Become a Green Liner!

Help me make more Money in the Stock Market.

ON ATGL

  • DashBoard
  • Weekly Commentary
  • Daily Buy / Sell Signals
  • Day Trade Setup
  • Trading Rooms

Design & Develop By Pixelvect

STRATEGIES

  • Swing Trading
  • ATGL Pick of the Week
  • Dividend Growth
  • ETF Sector Rotation
  • Dogs of the Dow

HELP

  • ATGL Trading Rules
  • FAQ
  • Account Maintenance
  • Contact US
  • Join

FOLLOW US

Instagram Linkedin Twitter Facebook

© COPYRIGHT 2024 · ABOVETHEGREENLINE.COM · ALL RIGHTS RESERVED · PRIVACY · TERMS · CONTACT · WATCHLIST · CURRENT