By ATGL
Updated May 29, 2026
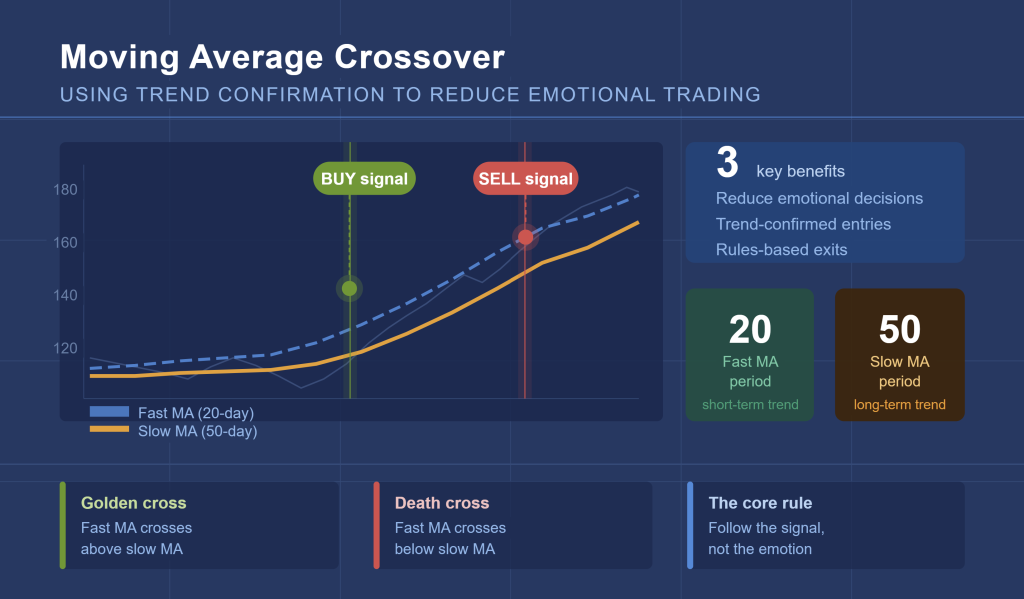
A moving average crossover strategy is a technical analysis method in which two or more moving averages of different timeframes are plotted on a price chart, generating a signal when the shorter-term average crosses above or below the longer-term average. Traders use this approach to identify trend shifts objectively, removing the subjectivity that often accompanies decisions based on price action alone.
Bullish crossovers occur when a shorter-term moving average crosses above a longer-term average, signaling potential upward momentum. Bearish crossovers are the inverse. Common timeframe combinations include 5/20 for short-term trading, 20/50 for swing trading, and 50/200 for long-term trend following. Each combination is designed to filter noise and highlight directional shifts across different holding periods.
By requiring a confirmed crossover before entering or exiting a position, traders impose structure on the decision-making process for each stock trade. This systematic approach reduces emotional reactions — fear-driven exits, premature entries — that frequently result in poorly timed trades.
How Moving Average Crossover Signals Confirm Market Trends
Moving averages smooth price data over a defined period, making it easier to assess trend direction. In a crossover system, the shorter-term average is more reactive to recent price changes, while the longer-term average reflects broader momentum. When the faster average rises above the slower one, it indicates that recent price activity is outpacing the long-term trend — a condition consistent with developing bullish momentum.
The distinction between simple vs. exponential moving averages is relevant here. Exponential moving averages (EMAs) assign greater weight to recent prices, increasing responsiveness. Simple moving averages (SMAs) apply equal weight across all periods, producing smoother but less reactive signals.
Crossover systems prioritize confirmation over anticipation. Rather than forecasting price direction, they wait for the market to demonstrate a trend before committing capital — providing a repeatable, rule-based framework for evaluating conditions objectively.
Applying Different Moving Average Timeframes for Strategic Goals
Timeframe selection in a simple moving average crossover strategy should reflect the trader’s objectives and holding period. Common setups include:
- 5/20 crossover: Suited for active and day traders. Generates frequent signals and responds quickly to price changes, but carries greater susceptibility to false signals during choppy conditions.
- 20/50 crossover: A standard setup for swing traders. Filters minor price noise while remaining responsive enough to capture intermediate trend shifts over days to weeks.
- 50/200 crossover: Designed for long-term trend followers. Produces infrequent but high-conviction signals with lower sensitivity to short-term volatility.
The core tradeoff across all setups is responsiveness versus reliability. Shorter timeframes generate more signals and earlier entries but also more false positives. Longer timeframes produce fewer, more reliable signals but may result in later entries and larger initial drawdowns before the position moves in the anticipated direction.
The Golden Cross and Death Cross as Long-Term Trend Benchmarks
The Golden Cross and Death Cross represent the best moving average crossover strategy for long-term directional assessment and are among the most closely monitored signals in technical analysis. A Golden Cross occurs when the 50-day moving average crosses above the 200-day, signaling a potential shift toward a bullish long-term trend. A Death Cross is the inverse — the 50-day crossing below the 200-day — indicating a possible transition to sustained bearish conditions.
These signals carry institutional weight. Portfolio managers and technical analysts track them as broad market directional indicators. While neither guarantees a trend reversal, both provide a data-supported context for evaluating long-term positioning and inform allocation decisions across equities, sectors, and ETFs.
Building a Disciplined Moving Average Crossover Trading System
Constructing an effective crossover system requires defining entry and exit criteria, incorporating stop-losses, and committing to consistent execution across varying market conditions.
A 50/200 crossover example illustrates this process clearly. A trader monitoring the S&P 500 waits for the 50-day SMA to cross above the 200-day SMA — a Golden Cross. The entry is placed at the close of the confirming candle. A stop-loss is set below a recent swing low to limit downside exposure. The position is exited when the 50-day crosses back below the 200-day or when the price closes through the stop level.
This rule-based structure removes discretionary judgment from execution. For additional context on applying moving averages in a forward-looking capacity, forecasting using moving averages outlines a practical methodology for trend-oriented traders.
Using 3-Moving-Average Systems to Reduce False Signals
A 3-moving average crossover strategy introduces a third average to strengthen trend confirmation and reduce whipsaws — rapid, contradictory signals that emerge when prices oscillate across moving averages without establishing a sustained directional trend.
Common configurations include 10/20/50 and 20/50/200. In a 10/20/50 system, a bullish signal is confirmed only when the 10-day crosses above the 20-day, and both are above the 50-day. This sequential alignment filters low-conviction entries. The 20/50/200 system applies the same logic across a wider timeframe range, making it well-suited for swing and position traders who require multi-timeframe confirmation before committing capital.
Managing Whipsaws and Sideways Market Conditions
Crossover strategies perform most reliably in trending markets. In choppy or range-bound conditions, moving averages converge, and crossover signals become unreliable. A whipsaw occurs when the shorter-term average briefly crosses the longer-term and immediately reverses, producing an entry that quickly invalidates. Repeated false signals in sideways markets can erode capital through a series of small, avoidable losses.
Several practical approaches reduce exposure to these conditions:
- Wait for candle closes: Acting only on confirmed closes beyond the crossover level filters intraday price spikes that do not represent genuine trend changes.
- Apply volume confirmation: A crossover supported by above-average trading volume carries greater conviction than one that forms on light participation, reflecting broader market commitment to the move.
- Use Relative Strength filters: Prioritizing securities that are outperforming their benchmarks distinguishes higher-quality crossover setups from weaker ones with lower follow-through potential.
Integrating Relative Strength for Higher-Probability Trade Filtering
Relative Strength measures a security’s performance relative to a benchmark or peer group over a defined period. When applied alongside a moving-average crossover strategy, it highlights market leaders. A bullish crossover in a security with strong Relative Strength carries greater statistical weight than the same signal in a lagging asset, improving the overall quality of trade selection.
The MACD crossover strategy offers a complementary confirmation tool. The MACD — Moving Average Convergence Divergence — measures the spread between two EMAs and identifies momentum shifts when its histogram crosses above or below the zero line. When a price-based crossover aligns with a MACD crossover above the zero line, the probability of a sustained move increases, reducing the risk of acting on an unreliable signal.
Reducing Emotional Bias Through Disciplined Trend Following
Maintaining discipline during periods of volatility is one of the most persistent challenges in active trading. Panic selling during drawdowns, chasing momentum near market peaks, and abandoning a strategy after consecutive losses are behavioral tendencies that consistently undermine long-term performance. Systematic crossover strategies address this directly by replacing discretionary judgment with defined, repeatable rules.
When entries, exits, and stop-loss placements are governed by specific crossover criteria, the process remains consistent regardless of short-term market fluctuations. This structure limits the influence of fear and overconfidence — two behavioral tendencies that distort timing and execution across all trading styles.
Above the Green Line’s proprietary systematic models apply this disciplined approach through structured scanning tools and trend-following frameworks designed to remove emotional bias at every stage of the process. Whether using short-term crossover setups or monitoring long-term 50/200 signals, systematic tools provide the consistency and objectivity needed for sustained execution.
Eliminate emotion from your trading by exploring ATGL’s membership options and gaining access to proprietary systematic models built for disciplined trend following.

Related Articles

ESPP Explained: The Employee Stock Purchase Plan Most Workers Leave Money On the Table By Ignoring
What Is a Bull Market? The Complete Guide Every Trader Needs Before the Next One Starts

Stock Market Hours: The ONLY Trading Windows That Actually Matter (Most Traders Get This Wrong)

Penny Stocks: How to Identify High-Probability Setups Using Rules-Based Investing