
By ATGL
Updated October 21, 2025
The MACD crossover above zero line is a frequently overlooked yet powerful confirmation signal in trend-based trading. Instead of focusing solely on MACD line and signal line interactions, this strategy emphasizes the importance of where the crossover occurs in relation to the zero line. When the crossover happens above zero, it supports the case for a sustained bullish move.
This guide will outline the signal’s technical foundation, explain its significance for momentum traders, and demonstrate how to apply it alongside complementary indicators and real chart patterns to enhance trade reliability.
What Does It Mean When MACD Is Above 0?
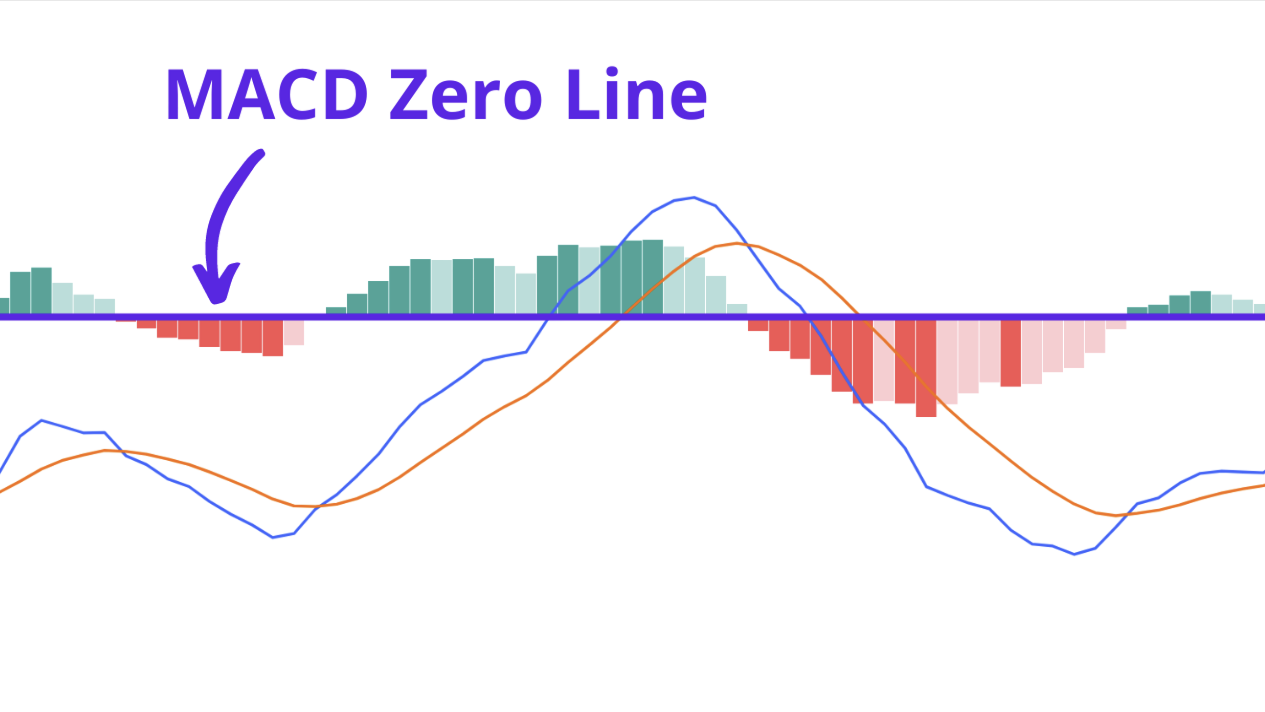
The MACD (Moving Average Convergence Divergence) is a lagging momentum indicator that measures the relationship between two Exponential Moving Averages (EMAs), usually the 12-period and 26-period EMAs.
It includes three key components:
- MACD Line: The difference between the 12-period EMA and the 26-period EMA.
- Signal Line: A 9-period EMA of the MACD line, used to generate crossover signals.
- Histogram: A visual representation of the distance between the MACD line and the signal line, indicating the strength of momentum.
When the MACD line crosses above the zero line, meaning that the MACD value becomes positive, it reflects that the 12-period EMA has risen above the 26-period EMA. This signifies that short-term price strength is now greater than long-term weakness — a key marker of bullish momentum. In many cases, this event corresponds with increasing price action and improved market sentiment.
Importantly, a MACD line above zero is not just an entry signal. It is a contextual marker. It confirms that upward momentum is in play and helps traders align their trades with a higher-probability directional bias. Traders relying on the MACD indicator gain a clearer view of when short-term strength overtakes long-term weakness.
What Is the MACD 0 Line Crossover Strategy, and How Does It Work?
The MACD zero line crossover strategy is based on observing when the MACD line moves from below to above the zero level. This occurs when the faster EMA (12-period) overtakes the slower EMA (26-period), which causes the MACD value to shift into positive territory.
When the MACD crossover above zero line occurs with the MACD line also crossing above the signal line, it strengthens the bullish bias. The combination of both crossovers indicates:
- Short-term acceleration of price relative to longer-term trends
- Confirmation of a bullish breakout or emerging uptrend
- Entry signal for traders seeking confirmation-based setups
Traders often rely on histogram bars expanding above zero as visual proof that momentum is strengthening. These increasing bars support the notion that buyers are in control and that the upward trend may have further room to run. Applying the MACD technical analysis tool helps traders validate momentum strength during crossover signals.
How to Use MACD Crossovers Above Zero for Trend Confirmation
Instead of relying on the zero line crossover alone, professional traders evaluate this signal as part of a larger market context. Here’s how to interpret it more accurately:
- Trend Confirmation: A crossover above zero during a period of price consolidation can help validate that a breakout has real strength. This is particularly valuable after a base formation or correction.
- Volume Alignment: A rise in volume accompanying the MACD zero line crossover supports conviction. If price and MACD are rising on below-average volume, traders often withhold confirmation until volume increases.
- Price Structure: The crossover is more meaningful when it coincides with higher highs in price. If MACD crosses above zero but price fails to break recent resistance, it could be a false signal.
This strategy is particularly effective when integrated into broader technical analysis frameworks that include price patterns, moving averages, and trendlines.
Entry and Exit Rules for MACD Crossovers Above Zero
Entry Conditions:
- MACD line crosses above the zero line
- MACD line crosses above the signal line simultaneously or just before
- Price action confirms with higher highs or breakout above resistance
- Volume is increasing or above average
Exit Signals:
- MACD histogram begins to contract after several bars of expansion
- MACD line crosses below the signal line while remaining above zero (a conservative exit)
- MACD line crosses back below zero (a more defensive exit)
- Price shows divergence from MACD (price makes higher highs while MACD weakens)
Annotated charts that include stochastic overlays and moving averages provide a clear view of how MACD-based entry and exit signals unfold in real-time. Traders are encouraged to backtest these setups — by applying the strategy to historical price data to evaluate past performance — across various securities and timeframes to ensure consistency and reliability.
How To Avoid False MACD Crossovers and Weak Momentum Signals
To reduce the risk of false MACD crossovers, avoid entering a trade solely because the MACD line has moved above the zero line. If the signal line crossover hasn’t occurred, the setup is incomplete. This is especially important in sideways or low-volume markets, where momentum is often unreliable.
Confirmation from other indicators adds confidence to the signal. If the Relative Strength Index (RSI) is trending above 50 and rising, it supports the bullish crossover. Traders often strengthen their analysis by using the RSI MACD divergence strategy to spot early shifts in momentum.
Bollinger bands offer another layer of confirmation. A MACD crossover above zero that occurs as price breaks the upper band may signal the start of a stronger move. Broader market strength can also be confirmed using the McClellan Oscillator, which tracks advancing versus declining stocks to gauge participation.
Finally, watch the MACD histogram. Inconsistent or flat histogram bars after a crossover often indicate weak momentum. Wait for clear, sustained expansion in the histogram before acting. This helps confirm that buying pressure is increasing and that the signal is more likely to be reliable.
Real Chart Examples of MACD Crossovers Above the Zero Line
To illustrate, consider a scenario where a stock consolidates within a tight range, followed by a bullish breakout on rising volume. The MACD line moves from below to above the zero line while also crossing the signal line. The histogram begins expanding, showing sustained momentum. Price confirms by pushing through a resistance level and establishing a new high.
Now contrast that with a stock where MACD crosses above zero, but volume is flat and price remains under resistance. The histogram expands slightly but then contracts quickly. These are signals to either avoid the trade or wait for further confirmation.
A textbook example occurs when a bullish pennant pattern breaks out and the MACD crossover above zero occurs within a few bars of the breakout. In such cases, the convergence of price action, pattern, and momentum indicator creates a statistically stronger setup.
Final Thoughts: Should You Trade MACD Crossovers Above Zero?
MACD crossovers above the zero line serve a dual purpose: they help confirm the strength of an emerging trend and provide structured entry signals that reduce guesswork. This signal becomes significantly more reliable when paired with volume analysis, price confirmation, and supporting indicators like RSI or Bollinger Bands. Traders seeking high-probability entries backed by technical evidence should consider integrating this strategy into their broader trading plans. As with all indicators, backtesting and risk management remain essential.
If you’re ready to take a systematic approach to trading by leveraging real-time alerts and technical signals, explore Above the Green Line membership options to access proprietary setups and professional chart analysis.

Related Articles

Penny Stocks: How to Identify High-Probability Setups Using Rules-Based Investing

Margin Call Explained: What Triggers It and How to Avoid One

AMC Short Squeeze Explained: Timeline, Causes, and Trading Risks

Volatility Clustering in Financial Markets: Understand Why It Happens
