By ATGL
Updated May 1, 2025
The bullish pennant pattern ranks among the most reliable continuation patterns in technical analysis. This pattern signals a temporary pause in an uptrend before prices continue their upward trajectory. For traders using chart patterns to inform their investment decisions, recognizing and accurately interpreting the bullish pennant offers substantial profit opportunities. This article examines the components of the bullish pennant pattern, explains how to identify it, provides trading strategies, and addresses critical considerations for risk management.
Understanding the Bullish Pennant
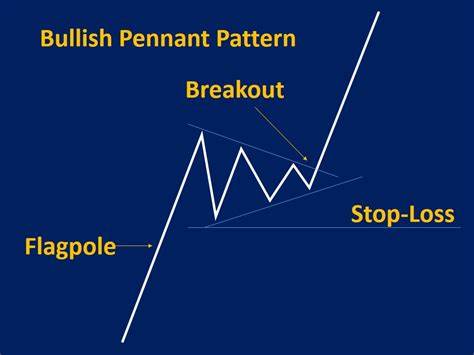
A bullish pennant pattern forms during an established uptrend and represents a brief consolidation period before the continuation of the bullish movement. This pattern consists of two primary components: a sharp, near-vertical price increase (the flagpole) followed by a small symmetrical triangle or pennant shape where the price consolidates. The pattern completes when the price breaks out above the pennant, suggesting the continuation of the previous uptrend.
The bull pennant differs from a bull flag primarily in its shape. While both patterns follow the same flagpole formation, a bull flag creates a rectangular channel sloping slightly downward during consolidation. In contrast, the bull pennant forms a symmetrical triangle with converging trendlines, creating a pennant or small triangle shape. This distinction affects trading strategy, as pennants typically indicate shorter consolidation periods.
When comparing a bullish pennant pattern to a bearish pennant, the fundamental structures mirror each other but occur in opposite market contexts. The bullish pennant forms during an uptrend and signals continued upward movement, while the bearish pennant develops during a downtrend and indicates further downward movement. Understanding these differences proves vital when navigating different bull vs. bear market conditions.
How To Identify the Bull Pennant Pattern
Accurate identification of a bull pennant pattern requires examination of several key components:
- The Flagpole: The pattern begins with a strong, sharp upward movement, creating the flagpole. This move typically occurs on high volume, representing strong buying pressure and momentum.
- The Pennant: Following the flagpole, the price enters a consolidation phase, forming a symmetrical triangle. During this phase, the trading range narrows as the upper and lower trendlines converge. Volume typically decreases during this consolidation.
- The Breakout: The pattern completes when the price breaks above the upper trendline of the pennant with increased volume. This breakout confirms the continuation of the previous uptrend.
Several technical indicators assist in confirming the validity of a bull pennant:
- Volume Analysis: Volume should be high during the initial price surge (flagpole), decrease during consolidation (pennant formation), and increase again during the breakout. This volume pattern confirms genuine buying pressure.
- Moving Averages: Short-term moving averages crossing above longer-term moving averages during or just before the breakout strengthen the bullish signal.
- Time Frame: The consolidation phase typically lasts between one to three weeks. Pennants that extend beyond this timeframe may indicate weakening momentum.
Technical analysts focus on identifying trends accurately, and the bull pennant provides a structured approach for recognizing continuation patterns within established uptrends.
How To Trade the Bull Pennant
Trading the bull pennant pattern effectively requires a disciplined approach to entry points, stop-loss placement, and profit targets:
- Entry Strategy: The optimal entry point occurs when the price breaks above the upper trendline of the pennant with increased volume. Conservative traders may wait for a candle to close above this resistance level to confirm the breakout.
- Stop-Loss Placement: Place stop-loss orders just below the lowest point of the pennant or below the lower trendline of the consolidation phase. This placement protects against false breakouts while maintaining a favorable risk-reward ratio.
- Profit Targets: The traditional measuring technique for profit targets adds the length of the flagpole to the breakout point. For example, if the flagpole represents a $10 price increase and the breakout occurs at $50, the profit target would be approximately $60.
Regarding success rates, research indicates that bull pennant patterns achieve their projected targets approximately 70% to 75% of the time when traded with proper breakout confirmation. This relatively high success rate explains why many professional traders incorporate this pattern into their technical analysis toolkit. However, market conditions, overall trend strength, and sector performance impact individual success rates.
The Psychology Behind the Bullish Pennant
The bull pennant pattern reflects specific phases of market psychology. During the initial uptrend (flagpole), buyers aggressively enter the market, pushing prices higher with conviction. This momentum attracts additional buyers who fear missing out on the movement.
The consolidation phase represents a temporary equilibrium between buyers and sellers. Early buyers take partial profits, causing minor price retracements, while new buyers gradually accumulate positions at more favorable prices. This tug-of-war creates the pennant formation with decreasing volume as participants await the next significant move.
The breakout occurs when buyers regain control and overcome the upper resistance level of the pennant. This renewed buying pressure confirms that the prevailing bullish sentiment remains intact, attracting additional participants who anticipate the continuation of the uptrend.
Understanding this psychological backdrop provides you with context beyond the visual pattern, supporting more confident decision-making and improved market insights.
How To Manage Risk With Bullish Pennants
Effective risk management proves critical when trading bull pennant patterns:
- Position Sizing: Limit exposure to an appropriate percentage of your portfolio based on the distance between your entry point and stop-loss level. A common approach allocates risk to no more than 1% to 2% of trading capital per position.
- False Breakout Protection: False breakouts occur when the price initially breaks above the pennant but quickly reverses. To mitigate this risk, confirm breakouts with volume increases and wait for a candle close above resistance. Some traders add a small buffer (3% to 5%) above the breakout level before entering.
- Trailing Stops: As the price advances following a successful breakout, adjust stop-loss orders to lock in profits. Some traders move their stops below recent swing lows or below short-term moving averages to protect gains while allowing the trend to develop.
- Multiple Timeframe Analysis: Confirm the pattern across different timeframes to increase confidence in the signal. A bull pennant identified on a daily chart gains additional validation when similar bullish structures appear on weekly and hourly charts.
The most successful traders recognize that proper risk management ultimately determines profitability, regardless of pattern recognition skills.
Recognizing Bullish Pennant Patterns for Trading Success
The bullish pennant pattern offers a structured approach to identifying continuation opportunities in uptrending markets. By mastering the components of this pattern — the flagpole, consolidation, and breakout — you can gain a powerful tool for timing entries and exits. The pattern’s psychological underpinnings also provide valuable insights into market sentiment, supporting more informed trading decisions.
To refine your technical analysis skills and incorporate advanced pattern recognition into your trading strategy, look to membership with Above the Green Line. We offer comprehensive educational resources and premium tools. Our membership programs also provide access to expert analysis, real-time pattern alerts, and personalized guidance to help you capitalize on bullish pennant opportunities. Visit our membership page to discover how our professional tools can enhance your trading results.

Related Articles
[pt_view id=”9517038dwu”]