Moving Average Convergence Divergence (MACD)
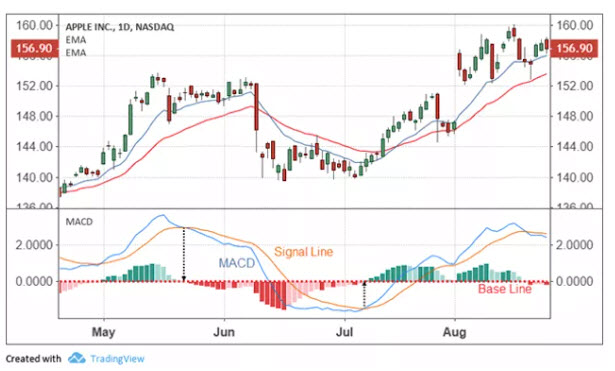
Moving Average Convergence Divergence (MACD) is a trend following momentum indicator that shows the relationship between two moving averages of a security’s price.
KEY TAKEAWAYS
- Moving Average Convergence Divergence (MACD) is calculated by subtracting the 26-period exponential moving average (EMA) from the 12-period EMA.
- MACD triggers technical signals when it crosses above (to buy) or below (to sell) its signal line.
- The speed of crossovers is also taken as a signal of a market is overbought or oversold.
- MACD helps investors understand whether the bullish or bearish movement in the price is strengthening or weakening.

MACD vs. Relative Strength
The relative strength indicator (RSI) aims to signal whether a market is considered to be overbought or oversold in relation to recent price levels. The RSI is an oscillator that calculates average price gains and losses over a given period of time; the default time period is 14 periods with values bounded from 0 to 100.
MACD measures the relationship between two EMAs, while the RSI measures price change in relation to recent price highs and lows. These two indicators are often used together to provide analysts a more complete technical picture of a market.