By ATGL
Updated February 1, 2026
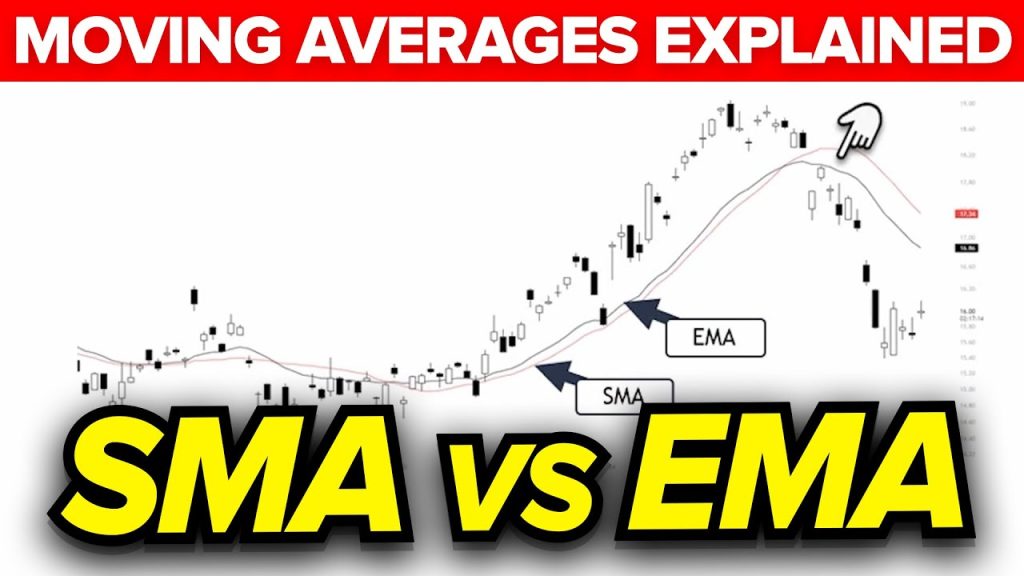
Moving averages help traders identify trends, time entries and exits, and filter market noise. The debate between simple versus exponential moving average centers on responsiveness versus stability. The simple moving average treats all data points equally, creating smoother signals with more lag. The exponential moving average prioritizes recent prices, generating faster signals with increased sensitivity. Understanding these differences in weighting price information allows you to select the indicator that aligns with your trading style and timeframe.
What Is a Simple Moving Average (SMA)?
A simple moving average calculates the arithmetic mean of closing prices over a specified period. The formula adds up closing prices and divides by the number of periods. A 10-day SMA, for example, totals the closing prices from the past 10 trading days and divides by 10. As new data arrives, the oldest price drops from the calculation.
This equal-weighted approach creates a smoother line that responds gradually to price changes. The slower reaction reduces false signals but increases lag time. Longer-term investors prefer SMAs for identifying major support and resistance levels. A 200-day SMA represents a widely-watched benchmark — prices above suggest bullish conditions, while prices below indicate bearish sentiment. The SMA’s stability makes it useful for confirming established trends rather than predicting reversals.
What Is an Exponential Moving Average (EMA)?
An exponential moving average applies a weighting multiplier that gives greater importance to recent prices. The calculation uses the formula: EMA = (Close – Previous EMA) × Multiplier + Previous EMA, where the multiplier equals 2 ÷ (Time Period + 1). A 10-day EMA uses a multiplier of 0.1818 (2 ÷ 11).
This weighting makes the EMA more responsive to current price action, adjusting faster than the SMA during quick market movements. However, increased sensitivity generates more fluctuations and potential false signals during choppy conditions. Active traders favor EMAs for identifying momentum and for precise entry and exit timing as trends develop.
Key Differences: Simple Moving Average vs. Exponential
The primary distinction lies in responsiveness to price changes. The simple moving average versus exponential comparison reveals that SMAs lag further behind current prices due to equal weighting of all data points. EMAs reduce this lag through exponential weighting, allowing the line to turn more quickly when trends shift. This responsiveness advantage narrows with longer timeframes — a 200-day EMA still reacts faster than a 200-day SMA, but the difference becomes less pronounced.
Volatility affects these indicators differently. SMAs filter out short-term fluctuations more effectively, producing cleaner signals in erratic markets. EMAs amplify recent price swings, capturing emerging trends but potentially triggering premature signals during consolidation. Your choice depends on whether you prioritize stability or speed.
Timeframes significantly impact performance. Shorter periods (10 to 20 days) generate frequent signals, while longer periods (50 to 200 days) identify broader trends. Many traders employ multiple timeframes simultaneously, using longer-period SMAs to confirm overall direction while shorter-period EMAs pinpoint tactical entry and exit points within that trend.
When To Use an SMA
SMAs work best in stable, trending markets where reducing noise takes precedence over early signal generation. Long-term position traders benefit from the SMA’s ability to filter out minor price fluctuations that don’t affect the broader trend. The indicator’s stability prevents overreaction to temporary corrections or brief counter-trend movements.
SMAs excel at identifying major support and resistance zones. Price often respects these levels more reliably because the equal weighting reflects collective market memory over the entire period. The indicator suits strategies focused on confirmation rather than prediction. If you prefer waiting for trends to establish before committing capital, the SMA’s lag becomes an advantage.
Reviewing current positions can help you identify established trends where SMAs might provide reliable support or resistance levels for setting stop-loss orders and profit targets.
When To Use an EMA
EMAs excel in fast-moving markets where early signal detection outweighs concerns about noise reduction. Day traders and short-term swing traders rely on the indicator’s responsiveness to capture momentum shifts as they develop, identifying trend changes before they appear on SMAs. This proves particularly valuable during earnings seasons, economic announcements, or other catalysts that drive rapid price movements.
The indicator works well for momentum-based approaches. Short-term EMAs (8 to 21 days) can signal entry points when prices pull back to the line during uptrends or rally to the line during downtrends. This helps traders add positions within established trends without waiting for deeper retracements.
Explore available trading tools to incorporate EMAs into your technical analysis. Shorter EMAs crossing above longer EMAs often signal buying opportunities, while the opposite crossover suggests potential exits.
Comparing SMA vs. EMA Side by Side
Many successful traders combine both indicators within a single strategy. A longer-term SMA establishes the overall trend direction, while a shorter-term EMA identifies tactical opportunities within that trend. For example, you might use a 200-day SMA to confirm a long-term uptrend and a 20-day EMA to time entries on pullbacks.
Crossover strategies frequently pair these indicators. When a short-period moving average crosses above a longer-period moving average, it generates a bullish signal. The reverse crossover produces a bearish signal. Using an EMA for the short period and an SMA for the long period balances responsiveness with stability, potentially improving signal quality.
Strategic fit depends on your trading style and objectives. Consider these factors:
Simple Moving Average
- Slower signal generation
- Fewer false signals in choppy markets
- Better for long-term trend confirmation
- Ideal for position traders and investors
Exponential Moving Average
- Faster signal generation
- More sensitive to recent price action
- Better for short-term momentum trading
- Ideal for active traders and swing traders
The dividend calendar and top 100 candidates provide additional resources for identifying stocks where moving average analysis might reveal actionable opportunities. Combining fundamental screening with technical indicators creates a comprehensive approach to market analysis.
Above the Green Line offers membership options that provide access to proprietary indicators and strategies incorporating both SMAs and EMAs. These tools help traders identify high-probability setups across different timeframes and market conditions, removing guesswork from technical analysis and improving decision-making consistency.

Related Articles

Are Municipal Bonds Tax Free? What Investors Need to Know

Reinvestment Strategy: Turning Income into Compounding Wealth

How the Elder Impulse System Helps Traders Time Their Entries

Kelly Criterion Trading: How to Size Positions with Confidence