By ATGL
Updated May 1, 2026
Leveraged exchange-traded funds attract investors and active traders with a compelling promise: amplified returns derived from standard market indices or assets. Understanding how leveraged ETFs work reveals that these instruments are not simply enhanced versions of conventional ETFs — they are precision tools designed for specific market conditions. A 2x leveraged ETF targets double the daily return of its benchmark, while a 3x leveraged ETF targets triple that return. When deployed in the right environment — a strong, low-volatility trending market — these funds can generate substantial gains in compressed timeframes. Deploying them under the wrong conditions, however, leads to accelerated losses and structural decay. These instruments are frequently mischaracterized as buy-and-hold investments, a misconception that contributes to significant capital erosion for unprepared investors. This article examines the mechanics driving leveraged ETFs, the market conditions that maximize their effectiveness, and the technical indicators that identify optimal entry and exit points.
For a broader foundation on how exchange-traded funds are structured and how different ETF types fit within a portfolio, refer to our comprehensive ETF Investing Guide
Mechanical Foundations: How Leveraged ETFs Achieve Amplified Returns
A leveraged ETF achieves its amplified returns through a combination of financial derivatives and debt instruments — primarily swaps, futures contracts, and options. Fund managers enter into derivative agreements with counterparties that pay a multiple of the daily return of the target index. For a 3x leveraged ETF — such as the ProShares UltraPro QQQ (TQQQ), which targets three times the daily return of the Nasdaq-100 — the fund uses swap agreements to gain $3 of exposure for every $1 of net assets. A 2x leveraged ETF operates on the same structure at a lower amplification ratio. The fund generates returns by capturing the leveraged daily movement of the underlying index, whether positive or negative. Understanding what a leveraged ETF is at its mechanical core is foundational before assessing its suitability for any portfolio strategy.
The Daily Reset Mechanism: Why Long-Term Returns Diverge From the Multiple
One of the most widely misunderstood characteristics of leveraged ETFs is that the leverage applies exclusively to each individual trading day. Every evening, the fund resets its derivative exposure to reflect the new net asset value, recalibrating to maintain the target leverage ratio for the following session. This daily reset has a significant compounding consequence: over multiple periods, the fund’s cumulative return diverges from a simple multiple of the index’s cumulative return. Consider this example:
Day 1: Index +10% → 2x ETF +20%
Day 2: Index −9.09% → 2x ETF −18.18%
Net Index Return: 0% | Net 2x ETF Return: approximately −1.8%
Despite the index returning to its starting value, the 2x ETF ends the sequence approximately 1.8% below its starting point. This divergence grows more pronounced as holding periods lengthen and market volatility increases, making long-term buy-and-hold strategies in leveraged ETFs fundamentally different from those applied to standard ETF funds vs. mutual funds.
Volatility Decay and the Hidden Costs of Compounding in Choppy Markets
The daily reset mechanism gives rise to volatility decay, sometimes referred to as beta slippage. When markets oscillate without a clear directional trend, repeated compounding of leveraged gains and losses erodes the fund’s net asset value — even when the underlying index ends a given period roughly flat. In a sideways or whipsawing market, each day’s leveraged loss compounds on a smaller base than the prior day’s leveraged gain, producing systematic attrition of capital. This asymmetry is mathematically unavoidable: a 10% gain followed by a 10% loss leaves a standard portfolio approximately 1% below its starting value, while a 3x leveraged ETF exposed to the same sequence — +30% followed by −30% — ends approximately 9% below its starting point. Traders who hold these instruments through extended periods of choppy, directionless price action often find that even a meaningful index recovery fails to restore prior portfolio values. Deploying leveraged ETFs without first assessing trend quality, therefore, exposes the investor to structural risk that operates independently of the market’s ultimate directional outcome.
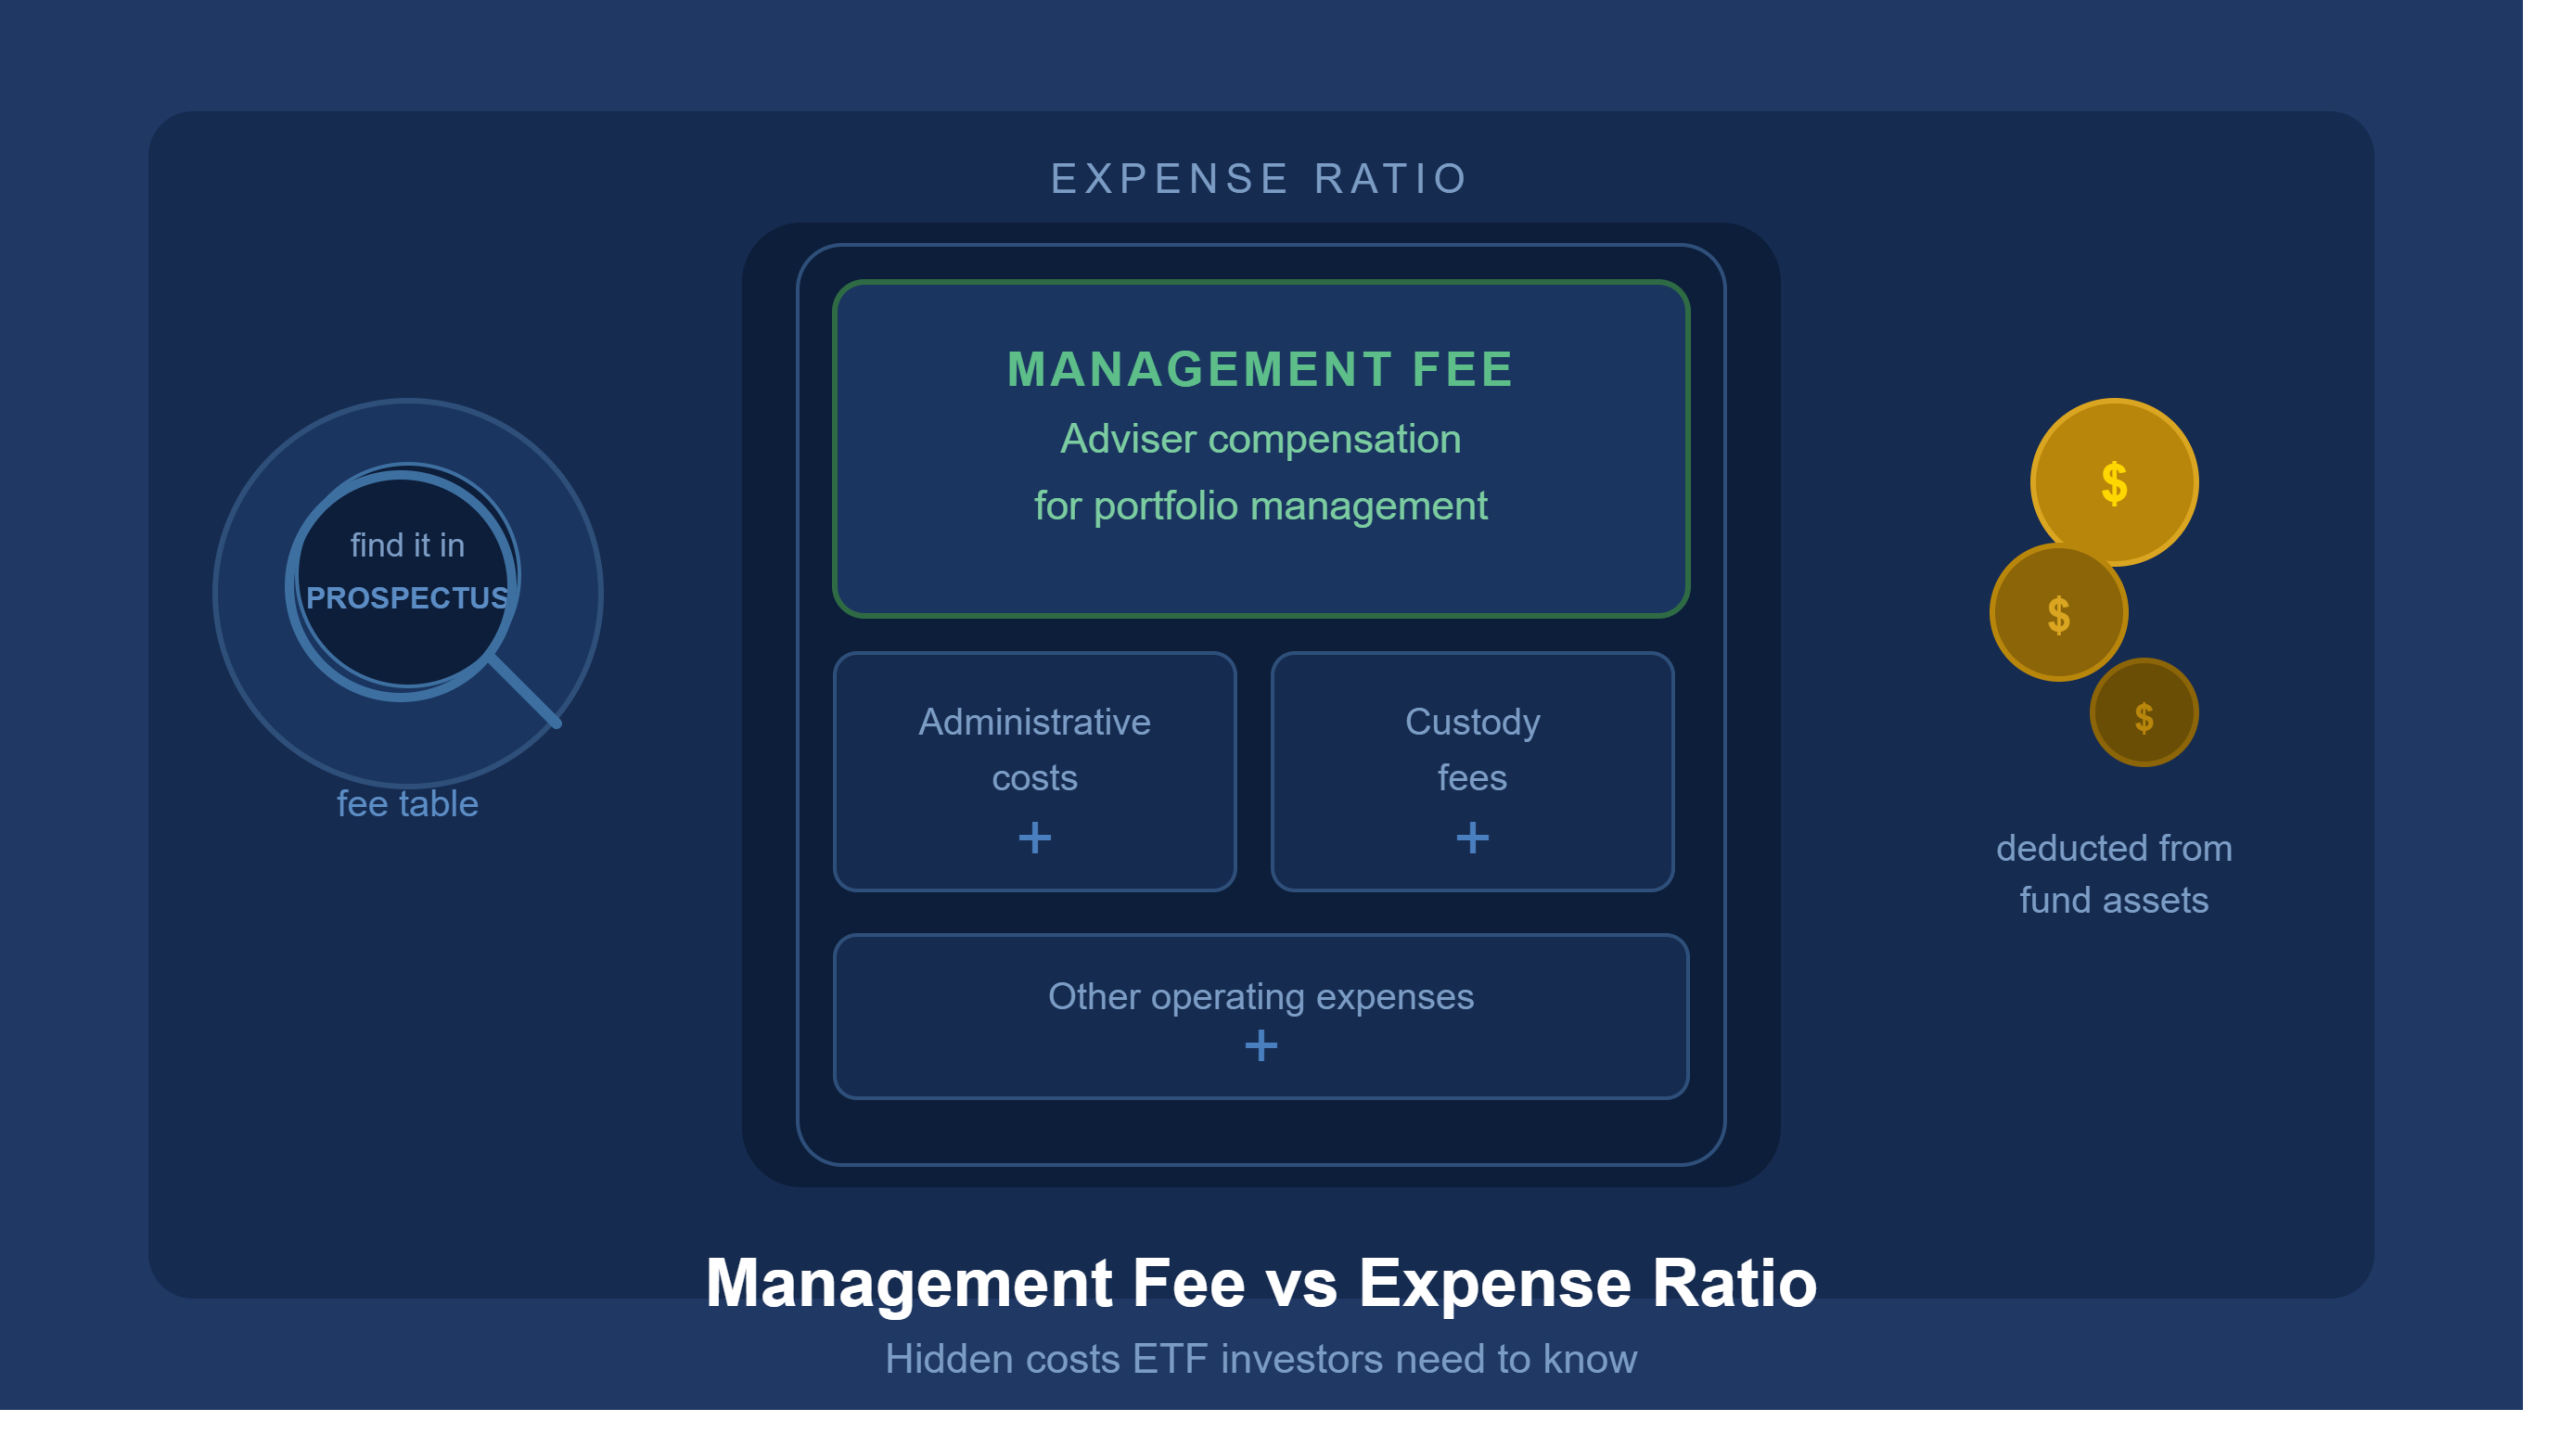
Internal Drag: Expense Ratios and Transaction Costs in Leveraged Funds
Beyond volatility decay, leveraged ETFs carry a higher internal cost structure than their non-leveraged counterparts. Expense ratios for these products typically range from 0.90% to over 1.00% annually — significantly higher than the sub-0.10% ratios common in broad-market index ETFs. The daily rebalancing required to maintain the target leverage ratio incurs continuous transaction costs within the fund itself, absorbed by shareholders through gradual NAV attrition. Leveraged ETFs also incur financing costs on their derivative exposure — effectively an interest charge on the borrowed component that fluctuates with prevailing short-term rates. Understanding stock trading costs — including the indirect costs embedded within fund structures — is important when evaluating net performance expectations. These carrying costs compound over time and widen the performance gap between the leveraged fund and a simple multiple of the index return.
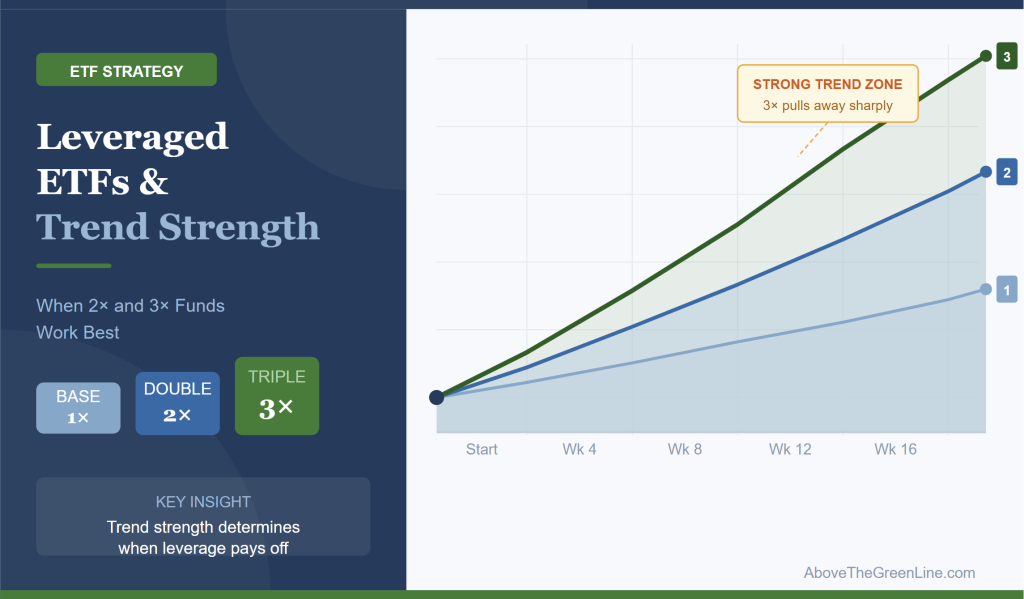
Identifying Optimal Windows: When Trend Strength Maximizes 2x and 3x Performance
The conditions under which leveraged ETFs perform best are well-defined: sustained, directional trends with relatively low intraday volatility. In these environments, daily returns consistently favor one direction, the compounding effect works in the trader’s favor, and volatility decay is minimized. Above the Green Line (ATGL) employs a systematic methodology to identify these optimal windows, using proprietary relative strength rankings to determine which sectors and instruments are in confirmed uptrends. These rankings isolate sectors demonstrating the highest rate of price appreciation relative to risk, providing an objective filter before any leveraged position is considered. The “green line” itself represents a technically defined threshold above which a security is considered to be in an established uptrend. When the underlying index of a leveraged ETF crosses and sustains above this threshold, conditions are generally favorable for deploying amplified long exposure.
Utilizing Moving Averages and Relative Strength to Time Entries
Moving averages and relative strength indicators are two of the most practical tools for determining when to enter or exit a leveraged ETF position. A 50-day or 200-day moving average confirms that the underlying index is in a sustained uptrend before a position is initiated. Relative strength compares the performance of a security or sector against a broader benchmark — when a sector demonstrates consistent outperformance relative to the S&P 500, concentrated momentum is present that leveraged exposure can amplify effectively. For swing trading leveraged ETFs, ATGL’s 7% rule provides a disciplined stop-loss mechanism: if a position declines 7% from the entry price, it is exited without exception. This rule limits downside exposure and preserves capital for re-deployment when trend conditions re-emerge.
Single-Stock Leveraged ETFs vs. Broad Index Amplification
Single-stock ETFs apply leverage to an individual company’s daily price movement rather than to a broad index. While this structure can produce significant short-term gains when a single company is in a strong directional trend, the concentration risk is substantially higher than with broad-index leveraged ETFs. A leveraged ETF targeting 3x the daily return of the Nasdaq-100 diversifies its amplified exposure across 100 companies, reducing the impact of any single company’s adverse event. Single-stock leveraged products amplify all the idiosyncratic risks associated with one issuer — earnings surprises, management changes, and regulatory actions — on top of the standard volatility decay affecting all leveraged structures. For most investors, broad-index leveraged ETFs represent a more controlled form of amplified market exposure.
Comparing Leveraged ETF Performance Against Conventional Exchange Traded Funds
Standard long-only ETFs are designed for sustained, multi-year holding periods and benefit from the compounding of market returns without the drag of daily rebalancing and elevated expense ratios. A conventional ETF tracking the S&P 500 holds the index’s constituent stocks in proportion to their weighting, providing transparent, low-cost exposure over time. Leveraged ETFs are tactical instruments — not substitutes for long-term index exposure, but tools for amplifying short- to medium-term directional moves. The former suits passive investors building long-term wealth; the latter suits active traders capable of monitoring positions closely and executing disciplined exits. The performance gap between a 3x leveraged ETF and three times the simple index return widens with both time and volatility. In strong trending markets spanning several weeks, a leveraged ETF may outperform expectations due to favorable compounding; in volatile or declining markets, the same mechanism accelerates drawdowns beyond what the simple leverage multiple implies.
Executing a Disciplined Strategy for Leveraged Investment Decisions
Leveraged ETFs reward structured analysis and penalize imprecision. Their effectiveness is directly tied to the quality of the prevailing trend: strong, directional, low-volatility markets with confirmed technical momentum represent the ideal deployment window for both 2x and 3x products. In the absence of these conditions, the structural costs of daily resets, volatility decay, and elevated expense ratios work against the investor regardless of directional conviction. A disciplined approach requires identifying confirmed trend conditions through objective technical criteria, applying pre-defined stop-loss rules such as the ATGL 7% threshold, and exiting positions when trend strength deteriorates. Above the Green Line’s systematic methodology provides investors and active traders with access to these signals through structured technical analysis and sector rotation rankings, removing the subjectivity that frequently undermines leveraged trading strategies.
Investors seeking a signal-driven approach to leveraged ETF allocation can access ATGL’s proprietary relative strength rankings, technical charting tools, and trading signals by joining the Above the Green Line membership community. The platform is built for traders and investors who prefer objective, rules-based decision-making over discretionary market timing — providing the analytical framework necessary to deploy leveraged ETFs with precision.

Related Articles
[pt_view id=”fb2451fm3r”]