By ATGL
Updated October 4, 2024
Investing in the stock market comes with its share of risks, and the market risk premium helps quantify the extra return investors expect for taking on these challenges. This concept plays a key role in how investors evaluate opportunities, manage systematic risk, and set their hurdle rates for potential investments.
Unlike specific risks tied to individual companies, such as default risk, market risk premium looks at the broader picture of stock market volatility. It’s a crucial tool for investors with various time horizons, from short-term traders to long-term portfolio managers. By understanding market risk premium, you’ll gain valuable insights into how the financial world prices risk and rewards, helping you make smarter investment choices and potentially boosting your returns over time.
Understanding Market Risk Premium
Market risk premium is a fundamental concept in finance that plays a significant role in investment decision-making. It represents the additional return an investor expects to receive for taking on the higher risk associated with investing in the stock market compared to a risk-free investment.
Importance of Market Risk Premium in Investments
The market risk premium is a critical component in assessing the potential returns of investments. It helps investors gauge whether the expected returns justify the risks they’re taking. By quantifying the excess return required to compensate for market risk, you can make more informed decisions about asset allocation and portfolio management.
Understanding market risk premium is essential for:
- Valuing assets: Used in various valuation models to determine the fair value of stocks and other securities.
- Setting investment strategies: Influences how investors allocate their assets between stocks and safer investments.
- Benchmarking performance: Serves as a benchmark for evaluating investment returns relative to market risk.
Market Risk Premium Calculation
Calculating the market risk premium involves comparing the expected return of the market to the risk-free rate. While the concept is straightforward, the practical application can be complex due to various factors influencing market expectations and risk-free rates.
What Is the Market Risk Premium Formula (CAPM)?
The Capital Asset Pricing Model (CAPM) is commonly used to calculate the market risk premium. The formula is:
Market Risk Premium = Expected Market Return – Risk-Free Rate
Where:
- Expected Market Return is the anticipated return of a broad market index (e.g., S&P 500)
- Risk-Free Rate is typically the yield on short-term government bonds
Factors Affecting the Calculation of Market Risk Premium
Several factors can impact the calculation and interpretation of market risk premium:
- Economic conditions: Economic growth, inflation, and interest rates can affect both market returns and risk-free rates.
- Market volatility: Higher volatility often leads to a higher risk premium as investors demand greater compensation for increased risk.
- Investor sentiment: Changes in risk appetite can influence the premium investors require.
- Historical data used: The time frame and data set used for historical returns can affect calculations.
- Future expectations: Forward-looking estimates of market returns can vary based on different forecasting methods.
Examples of Market Risk Premium Calculation
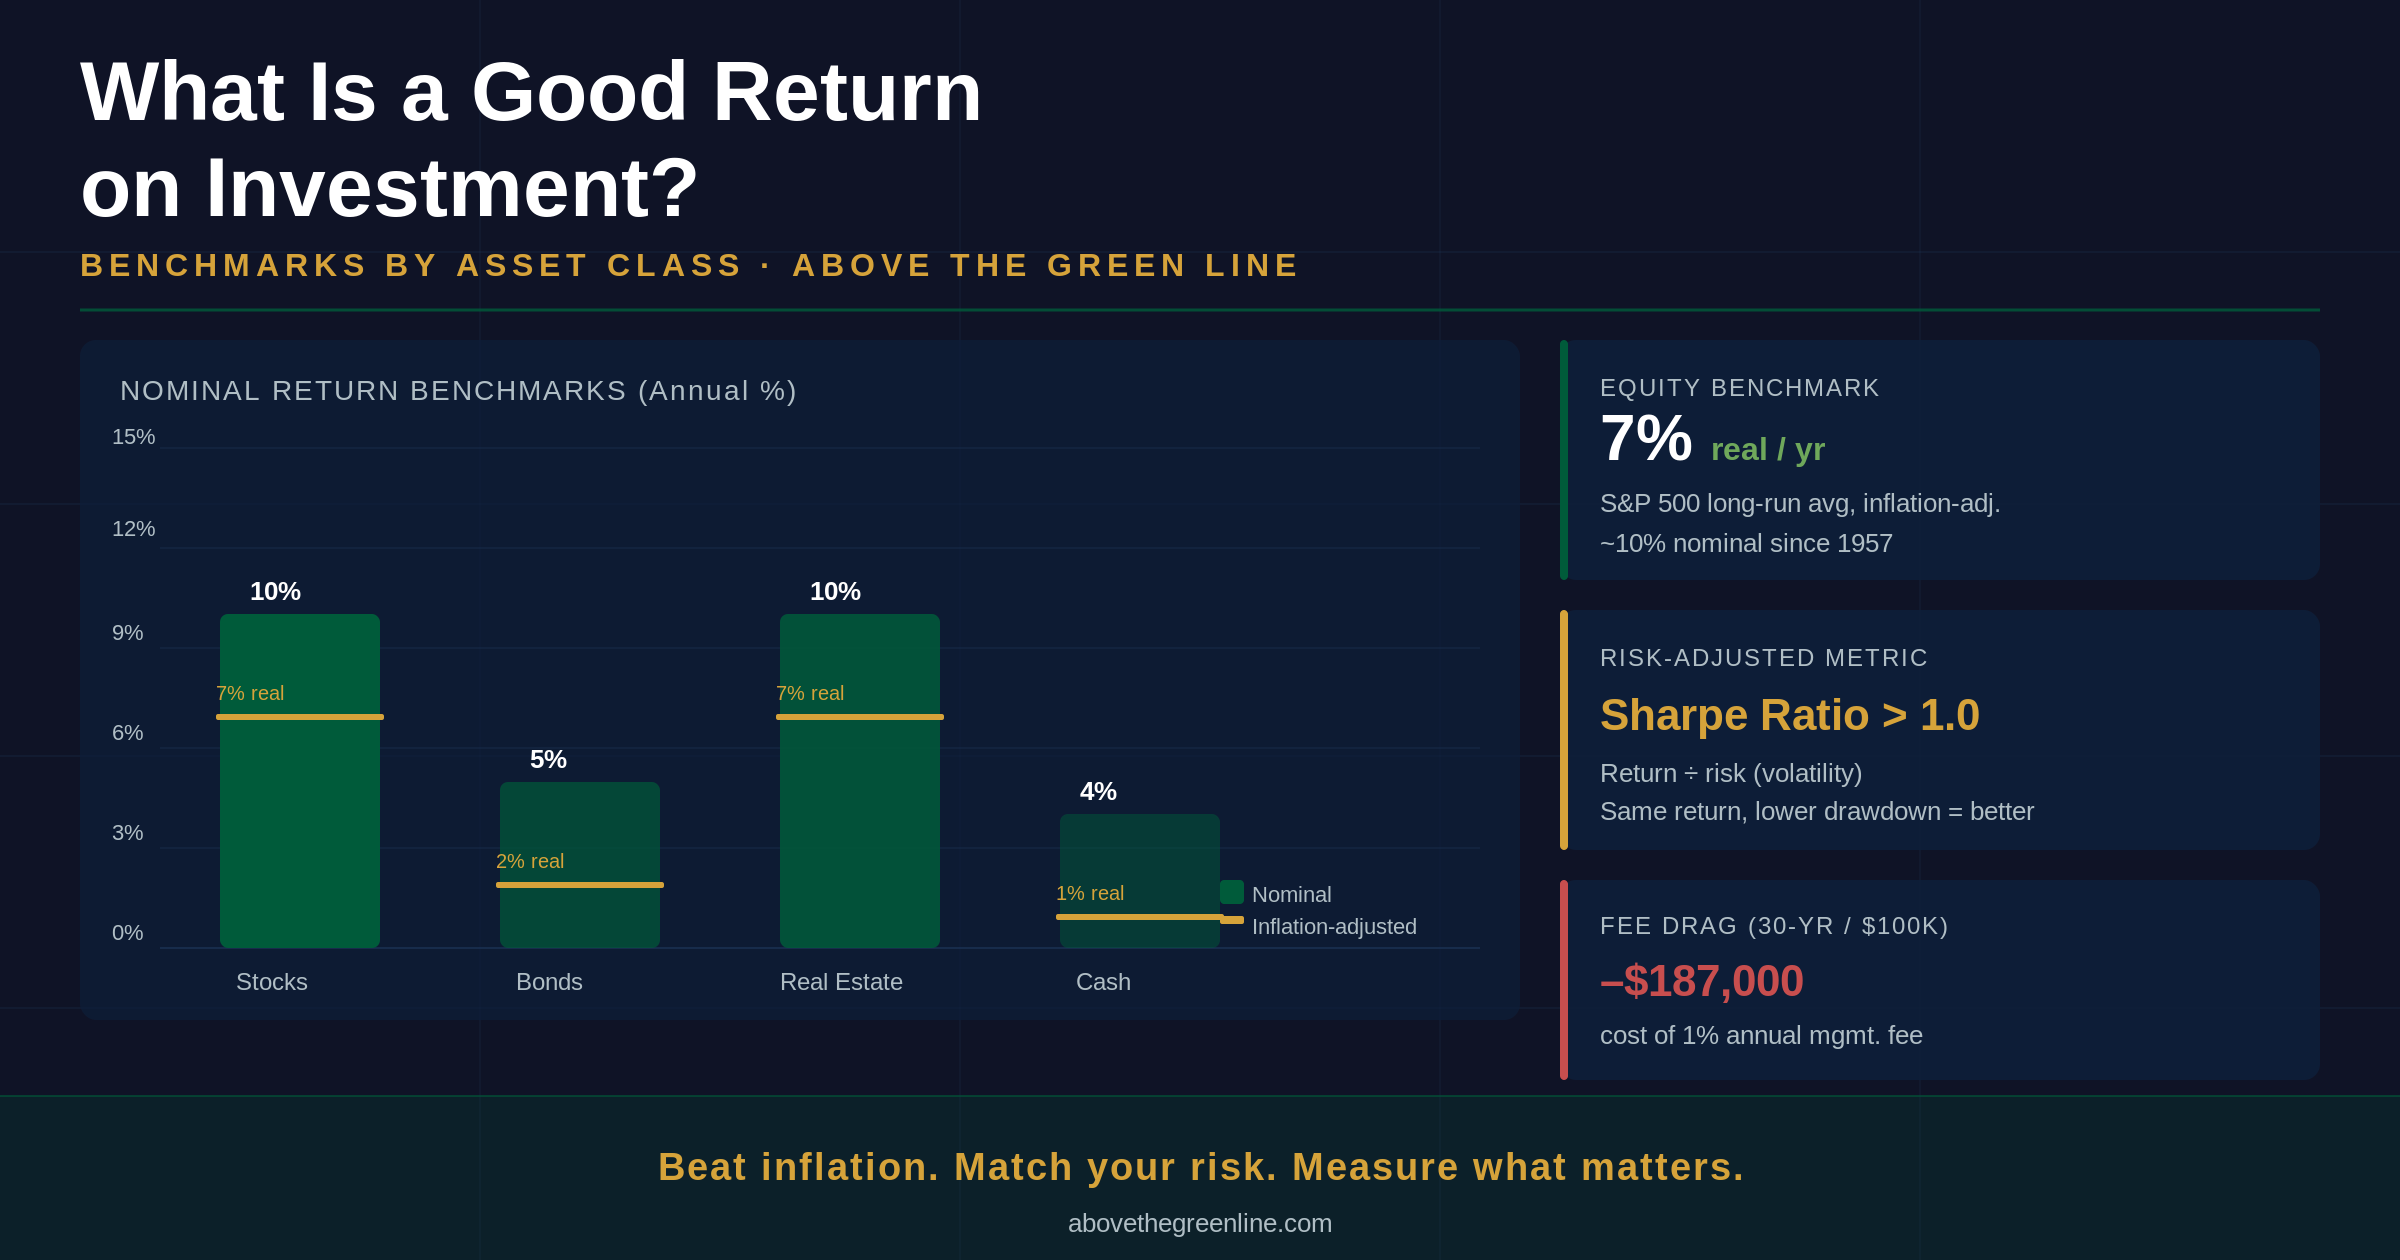
Suppose the expected return of the stock market is 10%, and the current risk-free rate (yield on 3-month Treasury bills) is 2%.
Market Risk Premium = 10% – 2% = 8%
This means investors, on average, expect to earn an 8% premium over the risk-free rate for investing in the stock market.
Note that market risk premiums can vary significantly over time and across different markets. For instance, during periods of economic uncertainty, the premium might be higher as investors demand greater compensation for increased risk.
Difference Between Market Risk Premium and Equity Risk Premium
While often used interchangeably, market risk premium and equity risk premium have subtle differences:
- Scope: Market risk premium typically refers to the overall stock market, while equity risk premium can be specific to individual stocks or sectors.
- Calculation: Market risk premium is usually calculated using broad market indices, whereas equity risk premium might use company-specific data.
- Application: Market risk premium is used in broader asset allocation decisions, while equity risk premium is more often applied in individual stock valuation.
- Variability: Equity risk premiums can vary significantly between different stocks or sectors, while market risk premium provides a more generalized view of risk across the entire market.
Uses of Market Risk Premium in Investing
The market risk premium has several practical applications in the world of investing.
Evaluation of Investment Opportunities
Investors use the market risk premium to assess whether potential investments offer sufficient returns to compensate for their risk. By comparing an investment’s expected return to the sum of the risk-free rate and market risk premium, you can determine if the investment is attractive given its risk profile.
Estimation of Expected Returns
The market risk premium is a key component in estimating expected returns for investments. It’s used in models like the Capital Asset Pricing Model and other multi-factor models to predict potential returns based on an asset’s sensitivity to market risk.
Determination of Investment Risk
By quantifying the additional return required for taking on market risk, the premium helps you gauge the level of risk associated with different investments. This aids in risk management and helps you align your portfolio with their risk tolerance.
Portfolio Optimization
In portfolio theory, the market risk premium plays a crucial role in optimizing asset allocation. It helps you balance risk and return across different asset classes to create efficient portfolios that maximize expected returns for a given level of risk.
Maximize Market Returns With Above the Green Line
Understanding and effectively utilizing market risk premium can significantly impact investment outcomes. At Above the Green Line, we provide tools and insights to help you navigate the complexities of market risk and optimize your investment strategies.
Our advanced analytics and market insights can help you:
- Accurately calculate and interpret market risk premiums
- Develop robust investment strategies that account for varying risk levels
- Optimize your portfolio allocation based on current market conditions
- Stay informed about changing market dynamics that affect risk premiums
By leveraging our expertise in areas such as weighted average cost of capital and market risk analysis, you can make more informed investment decisions and potentially enhance your returns.
Visit our membership page to learn more about how Above the Green Line can help you harness the power of market risk premium analysis and elevate your investment strategy. Our comprehensive tools and expert guidance can provide you with the edge you need in today’s complex financial markets.

Related Articles
[pt_view id=”b47aec5l7b”]