Above the Green Line -01
  • Market Insights
        • Commentary
          • Daily
          • Weekly
        • BUY / SELL SIGNALS
          • Trade Posts
          • Recent Trade Alerts
          • Recent Day Trades
        • BLOGROLL
          • Dividend Growth Blog
          • ETF Sector Blog
          • Dow Dogs
          • TPOW Blog
  • Strategies
        • SWING TRADING
          • Current Positions
          • Watchlists
          • Closed Positions
          • Candidates - TOP 100
          • Specialty Stocks
        • WEEKLY STOCK PICK
          • TPOW Charts
          • TPOW Performance
          • TPOW Strategy Guide
          • TPOW Performance Dashboard
        • DAY TRADING
          • Watch List
        • ATGL DASHBOARD
        • ETF STRATEGIES
          • ETF Sector Rotation
          • ETF Sector Portfolio
        • DIVIDEND GROWTH
          • Dividend Growth Portfolio
          • Dividend Calendar
        • DOGS OF THE DOW
          • Dogs of the Dow Portfolio
          • DOW 5 Portfolio
  • Markets
        • US MARKET
          • Commodities
          • Energy
          • Precious Metals
          • Volatility
        • GLOBAL MARKETS
          • Market Indices
          • Economic Calendar
          • FOREX Heat Map
          • FOREX Cross Rates
          • Crypto Currency Market
  • Investing
    • Discord Community
    • Dashboard
  • Resources
        • ARTICLES
          • Dividend Growth Model Articles
          • ETF Articles
          • Investment Strategies Articles
          • Market and Economic Insights
          • Stock Trade Articles
          • Stock Reviews
        • TOOLS
          • Stock Scanners
          • Charting Software
          • Brokerage Firms
        • STOCK CHARTS
          • Key Components
          • Reading Charts
          • Drawing Stock Charts
          • Identifying Trends
        • RETIREMENT PLANNING
  • About
    • Contact Us
    • How to Win
    • #1 At Stockcharts
    • Disclaimer
    • FAQ
  • Log In
  • Subscribe

February 11, 2019

Money Wave Alert! Feb 11, 2019

Money Wave List

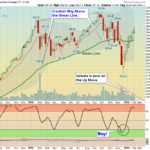
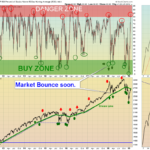
    Markets  were mixed today on low Volume as only the Strongest Leaders seem to have much Buying. The S&P 500 is trying to hold above the Pink Line of 2705.  The Money Wave Buy list is growing as the Leaders are now correcting … [Read more...]

February 10, 2019

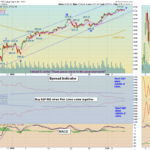
Green Line Weekly Feb 10, 2019

DIA Chart

  02/10/2019:  Markets  were mixed for the week as the bargain hunting seems to have ended from a 16% bounce up off the Lows. But with Long Term Interest Rates and Inflation still historically low, there is no real competing Investment to … [Read more...]

February 8, 2019

Money Wave Alert! Feb 8, 2019

QQQ Chart

  Markets  were down again today on mild Selling. The S&P 500 is trying to hold above the Pink Line of 2697.  The Tech Stocks are up slightly, and the Money Wave Buy list is growing as the Leaders are now correcting down. Markets have … [Read more...]

February 7, 2019

Money Wave Alert! Feb 7, 2019

SPX Chart

  Markets  were down today as Sellers finally took control. The Support on the S&P 500 is the Pink Line of 2693.  The S&P 500 was very Over-bought on the Short Term after a 16% bounce up from the Lows. Markets have not pulled back … [Read more...]

February 6, 2019

Money Wave Alert! Feb 6, 2019

SPX-60-min

  Markets  were mixed today as the 6 week rally appears to be losing momentum on low Volume.  The S&P 500 is currently very Over-bought on the Short Term after a 16% bounce up from the Lows. Markets have not pulled back enough to … [Read more...]

February 5, 2019

Money Wave Alert! Feb 5, 2019

BA Chart

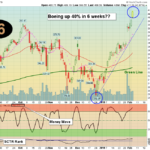
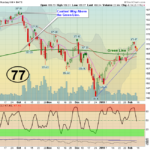
  Markets  were up again today on more low Volume as Investors continued to Buy without regard to risk. The Boeing Chart above shows how quickly emotions can change the value of a Large Company by 40%. The S&P 500 is currently very … [Read more...]

February 4, 2019

Money Wave Alert! Feb 4, 2019

IWM Chart

  Markets  were up today on low Volume as Investors have no News or reason to Sell. Earnings are mostly coming out better than expected, and the FEAR has disappeared in just 6 weeks. The S&P 500 is currently very Over-bought on the Short … [Read more...]

February 3, 2019

Green Line Weekly Feb 3, 2019

SPX Mo chart

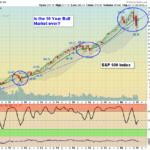
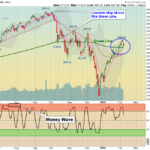
  02/03/2019:  Many have been asking if the recent pull back in the Markets was another Correction like in 2011 and 2016, or has the 10 Year Bull Market ended. Many are predicting the answer, but they don't know. With Charting or Technical … [Read more...]

February 1, 2019

Money Wave Alert! Feb 1, 2019

% 50 Chart

  Markets  were mixed again today after having a rally in the morning on Good News.  The Tech stocks were lower, and there was weakness from AMZN Earnings. The S&P 500 currently very Over-bought on the Short Term after a 15% bounce up … [Read more...]

January 31, 2019

Money Wave Alert! Jan 31, 2019

SPX Chart

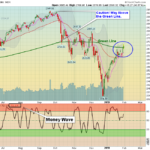
  Markets  were mixed today after yesterday's big rally.  The S&P 500 should close Above the Green Line today, but it is currently very Over-bought on the Short Term. Please be patient and WAIT for Money Wave Buy Signals. Most of the … [Read more...]

  • « Previous Page
  • 1
  • …
  • 355
  • 356
  • 357
  • 358
  • 359
  • …
  • 363
  • Next Page »

Subscribe to Our Newsletter

AGL Logo

Get our eBook Now!

Candlestick - A Swing Traders Friend

We don’t spam! Read our privacy policy for more info.

You’ve been successfully subscribed to our newsletter!

Voted #1 at Stock Charts

SH Chart
Inverse S&P 500 Fund (SH) will have a Money Wave Buy today.

Help Us Help Animals

Help Us Help Animals

Recent Comments

  • Want to Protect Your Capital? Start With Better Position Sizing on Risk Management in Trading: Tools and Techniques
  • Want to Protect Your Capital? Start With Better Position Sizing on Swing Trading Risk Management: Tips To Safeguard Your Profits
  • Price Action Trading Strategies That Work in Any Market on What Is a Death Cross in Stocks? A Bearish Market Signal
  • ATGL Weekly Money Flow - 2025-07-13 on AGTL Top Pick of the Week! May 11, 2025
  • Market Breadth Indicators: A Trader’s Guide to Early Trend Detection on Backtesting: Definition and How a Trading Strategy Backtest Works

Become a Green Liner!

Help me make more Money in the Stock Market.

ON ATGL

  • DashBoard
  • Weekly Commentary
  • Daily Buy / Sell Signals
  • Day Trade Setup
  • Trading Rooms

Design & Develop By Pixelvect

STRATEGIES

  • Swing Trading
  • ATGL Pick of the Week
  • Dividend Growth
  • ETF Sector Rotation
  • Dogs of the Dow

HELP

  • ATGL Trading Rules
  • FAQ
  • Account Maintenance
  • Contact US
  • Join

FOLLOW US

Instagram Linkedin Twitter Facebook

© COPYRIGHT 2024 · ABOVETHEGREENLINE.COM · ALL RIGHTS RESERVED · PRIVACY · TERMS · CONTACT · WATCHLIST · CURRENT