
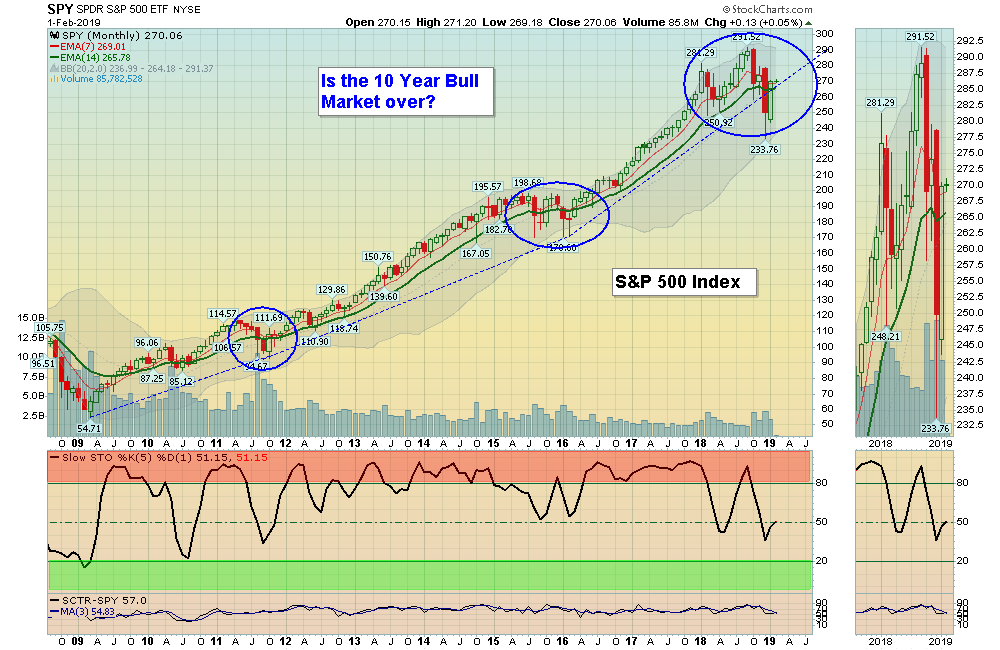
02/03/2019: Many have been asking if the recent pull back in the Markets was another Correction like in 2011 and 2016, or has the 10 Year Bull Market ended. Many are predicting the answer, but they don’t know. With Charting or Technical Analysis we Count the Money Flow.
After a long Trend upward, usually the Investment will TELL US when to Sell either by breaking below the Trend Line or Failing to make a New High (Right Shoulder). We will have to WAIT to see. We like to Buy strong Investments that have recently pulled back from New Highs, and currently that list has become small. But if you continue to follow the Green Line Rules you should make more than you lose in any type of Market (the Money has to go somewhere).
Markets were up again this week as several Indices closed back Above the Green Lines. However, the DOW & S&P 500 have bounced about 15% up off the Lows which will probably indicate that some profit taking will come in soon.
For the week the Dow was up 1.32%, the S&P 500 was down 1.61%, and the Nasdaq 100 was up 1.30%. The very Long Term Trend on the Stock Markets is UP. The DOW Index, S&P 500 and the NASDAQ 100 are the major US Indices that closed Above the Green Lines.
The Inflation Index (CRB) was down 0.07% and is Below the Green Line, indicating Economic Weakness.
Bonds were down 0.58% for the week and are Above the Green Line, indicating Economic Weakness.
The US DOLLAR was down 0.20%, and the Relative Strength is now dropping.
Crude Oil was up 2.92% for the week at $55.26, and GOLD was up 1.85% at $13.22.
___________________________________________________________________________________________
MONEY WAVE BUYS SOON:
We are currently in 5 logged Open Positions, for the Short & Medium Term. There are 2 Investments on the Short Term Watch List.
Be patient and WAIT for Green Zone Buy Signals!
______________________________________________________________________________________________
LONG TERM TRADES
Many of the Strongest Investments that bounced up off the Green Line with Above 80 Relative Strength, are now getting back into their Red Zones on the weekly charts (Danger Zone).
ARWR ARROWHEAD PHARMA. Buy if it Closes above $15.47.
FTNT FORTINET INC. Caution! Weekly Money Wave is almost to the Red Zone.
GNW GENWORTH FINANCIAL Buy if it Closes above $5.27.
I INTELSAT GLOBAL Wait for the next Daily Money Wave Buy Signal.
LW LAMB WESTON HOLDINGS Buy if it Closes above $73.18.
PFE PFIZER, INC. Wait for the next Daily Money Wave Buy Signal.
UAL UNITED CON’T. AIR Wait for the next Daily Money Wave Buy Signal.
VER VEREIT, INC. Buy if it Closes above $7.89. (7% Dividend)
___________________________________________________________________________________________
Click for Portfolio (Open Positions)
Click for Watch List
Click for Closed Positions
Alert! Market Risk is HIGH (Red Zone). The probability of successful Short Term Trades is better, when the % of stocks above the 50-day avg. is below 20.
Tell your Friends about the Green Line, and Help Animals.
QUESTION: Nancy writes “I would like to know where the relative strength factor is located on the charts.”
ANSWER: Hi Nancy, the Relative Strength is usually on the bottom left of each Chart with a Red Box around it (SCTR is StockCharts Technical Rank). Sometimes we use data from:
Relative Strength Values comes from the SCTR Rank (StockCharts Technical Rank), www.etfscreen.com for ETFs , and Investor’s Business Daily (IBD) for stocks. We prefer the longer term weighting used by www.etfscreen.com and IBD.
Sometimes look for Big Numbers with circle around them…
Good trading, and tell your friends!


