
01/27/2019: Markets were mixed for the week after bouncing up from a sell off earlier. So far the DOW Index has bounced up 3160 points without much of a pull back and the FEAR is gone. That will probably indicate that some profit taking will come in soon.
We like to Buy when the Herd is Selling, and now the Herd seems to be Buying again after a 12%+ pop off the lows.
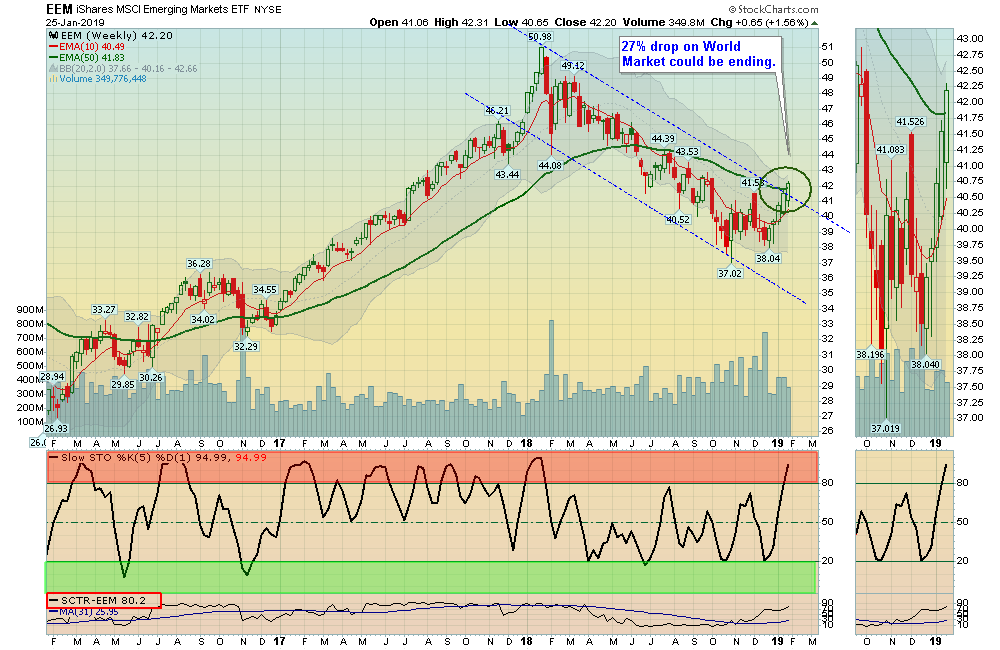
The World Markets could be bottoming after a one year decline of 27%. Maybe the US Dollar is topping out.
Investor Sentiment has turned much more positive according to the FEAR Index.
For the week the Dow was up 0.12%, the S&P 500 was down 0.26%, and the Nasdaq 100 was up 0.04%. The very Long Term Trend on the Stock Markets is UP. The DOW Index and the NASDAQ 100 are the major US Indices that closed Above the Green Lines.
The Inflation Index (CRB) was down 0.84% and is Below the Green Line, indicating Economic Weakness.
Bonds were down 0.81% for the week and are Above the Green Line, indicating Economic Weakness.
The US DOLLAR was down 0.47%, and the Relative Strength is now dropping.
Crude Oil was down 0.65% for the week at $53.69, and GOLD was up 1.21% at $1298.
___________________________________________________________________________________________
MONEY WAVE BUYS SOON:
We are currently in 6 logged Open Positions, for the Short & Medium Term. There are 3 Investments on the Short Term Watch List.
Be patient and WAIT for Green Zone Buy Signals!
______________________________________________________________________________________________
LONG TERM TRADES
Investments below that can Bounce up off the Green Line with Above 80 Relative Strength, could re-test their recent Highs.
ARWR ARROWHEAD PHARMA. Buy if it Closes above $15.47.
FTNT FORTINET INC. Buy if it Closes above $75.29.
GME GAME STOP CORP. Buy if it Closes above $16.90.
GNW GENWORTH FINANCIAL Buy if it Closes above $5.27.
I INTELSAT GLOBAL Buy if it Closes above $24.28.
PFE PFIZER, INC. Wait for the next Daily Money Wave Buy Signal.
UAL UNITED CON’T. AIR Wait for the next Daily Money Wave Buy Signal.
VER VEREIT, INC. Buy if it Closes above $7.89. (7% Dividend)
___________________________________________________________________________________________
Click for Portfolio (Open Positions)
Click for Watch List
Click for Closed Positions
Alert! Market Risk is MEDIUM HIGH (Orange Zone). The probability of successful Short Term Trades is better, when the S&P 500 is down near the Green Line.
Tell your Friends about the Green Line, and Help Animals.
4 Ways to Get your Daily Money Wave Alert:
- Emailed to your box between 3:30 3:50pm EST.
- Website menu Commentary/Buy/Sell Signals
- Twitter notifications are the fastest and most reliable @AboveGreenLine
- Text messages: Email us your Cell number & phone carrier.


