
02/10/2019: Markets were mixed for the week as the bargain hunting seems to have ended from a 16% bounce up off the Lows. But with Long Term Interest Rates and Inflation still historically low, there is no real competing Investment to Stocks other than CDs at the Bank.
Markets need more FUEL to go higher. Earnings for last quarter should be at least 10% + higher, but Investors need a Trade Deal with China or something similar to convince them that Earnings have not peaked.
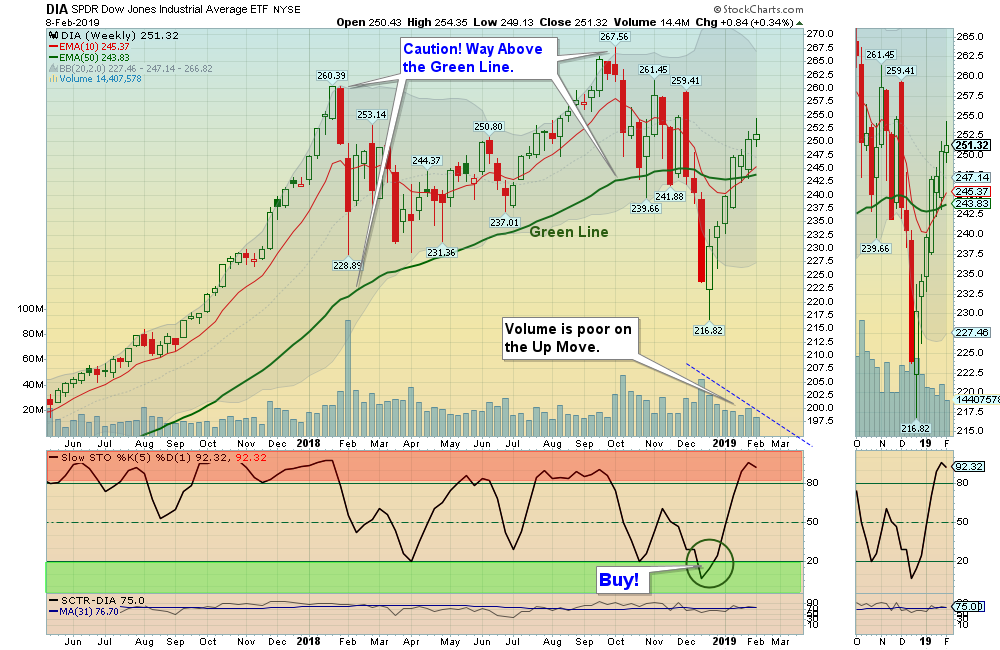
For the week the Dow was up 0.17%, the S&P 500 was up 0.15%, and the Nasdaq 100 was up 0.55%. The very Long Term Trend on the Stock Markets is UP. The DOW Index, S&P 500 and the NASDAQ 100 are the major US Indices that are Above the Green Lines.
The Inflation Index (CRB) was down 0.04% and is Below the Green Line, indicating Economic Weakness.
Bonds were up 0.43% for the week and are Above the Green Line, indicating Economic Weakness.
The US DOLLAR was up 1.30%, and is over-bought again.
Crude Oil was down 4.60% for the week at $52.72, and GOLD was down 0.27% at $1319.
___________________________________________________________________________________________
MONEY WAVE BUYS SOON:
We are currently in 5 logged Open Positions, for the Short & Medium Term. There are 5 Investments on the Short Term Watch List.
Be patient and WAIT for Green Zone Buy Signals!
______________________________________________________________________________________________
LONG TERM TRADES
Many of the Strongest Investments that bounced up off the Green Line with Above 80 Relative Strength, are now getting back into their Red Zones on the weekly charts (Danger Zone).
ARWR ARROWHEAD PHARMA. UP 9.5% this week. Wait for the next Daily Money Wave Buy Signal.
AVP AVON PRODUCTS Buy when it Closes above $2.99.
FTNT FORTINET, INC. Wait for the next Daily Money Wave Buy Signal.
GNW GENWORTH FINANCIAL Buy if it Closes above $5.27.
I INTELSAT GLOBAL Wait for the next Daily Money Wave Buy Signal.
LW LAMB WESTON HOLDINGS Buy if it Closes above $73.18.
PFE PFIZER, INC. Wait for the next Daily Money Wave Buy Signal.
UAL UNITED CON’T. AIR Wait for the next Daily Money Wave Buy Signal.
VER VEREIT, INC. Wait for the next Daily Money Wave Buy Signal. (7% Dividend)
___________________________________________________________________________________________
Click for Portfolio (Open Positions)
Click for Watch List
Click for Closed Positions
Alert! Market Risk is HIGH (Red Zone). The probability of successful Short Term Trades is better, when the % of stocks above the 50-day avg. is below 20.
Tell your Friends about the Green Line, and Help Animals.
QUESTION: RUI writes “On the Portfolio page with the current positions, may I know what’s the parameters to shift the “legend” to yellow “Don’t take a loss?”
ANSWER: Hi Rui. Usually after a Money Wave Buy Signal, the Investment should pop 3-5% in a few days. When the Money Wave is > 50 and the Investment is not doing well, then something might be wrong (maybe the Market has not have bottomed).
So for Short Term Trading we suggest getting out Before you take a Loss, and try to get back in Lower.
Good trading, and tell your friends!


