Above the Green Line -01
  • Market Insights
        • Commentary
          • Daily
          • Weekly
        • BUY / SELL SIGNALS
          • Trade Posts
          • Recent Trade Alerts
          • Recent Day Trades
        • BLOGROLL
          • Dividend Growth Blog
          • ETF Sector Blog
          • Dow Dogs
          • TPOW Blog
  • Strategies
        • SWING TRADING
          • Current Positions
          • Watchlists
          • Closed Positions
          • Candidates - TOP 100
          • Specialty Stocks
        • WEEKLY STOCK PICK
          • TPOW Charts
          • TPOW Performance
          • TPOW Strategy Guide
          • TPOW Performance Dashboard
        • DAY TRADING
          • Watch List
        • ATGL DASHBOARD
        • ETF STRATEGIES
          • ETF Sector Rotation
          • ETF Sector Portfolio
        • DIVIDEND GROWTH
          • Dividend Growth Portfolio
          • Dividend Calendar
        • DOGS OF THE DOW
          • Dogs of the Dow Portfolio
          • DOW 5 Portfolio
  • Markets
        • US MARKET
          • Commodities
          • Energy
          • Precious Metals
          • Volatility
        • GLOBAL MARKETS
          • Market Indices
          • Economic Calendar
          • FOREX Heat Map
          • FOREX Cross Rates
          • Crypto Currency Market
  • Investing
    • Discord Community
    • Dashboard
  • Resources
        • ARTICLES
          • Dividend Growth Model Articles
          • ETF Articles
          • Investment Strategies Articles
          • Market and Economic Insights
          • Stock Trade Articles
          • Stock Reviews
        • TOOLS
          • Stock Scanners
          • Charting Software
          • Brokerage Firms
        • STOCK CHARTS
          • Key Components
          • Reading Charts
          • Drawing Stock Charts
          • Identifying Trends
        • RETIREMENT PLANNING
  • About
    • Contact Us
    • How to Win
    • #1 At Stockcharts
    • Disclaimer
    • FAQ
  • Log In
  • Subscribe

March 21, 2019

Money Wave Alert! Mar 21, 2019

QQQ Chart

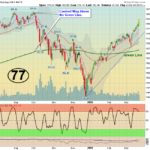
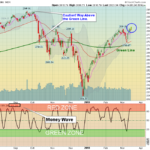
  Markets were higher today as the Indices bounced up off the Pink Lines (10-day avgs.) on lower Volume. Yesterday the S&P 500 Index bounced up off of last week's Support of 2817.  AAPL finally Closed above it's 200-day average of … [Read more...]

March 20, 2019

Money Wave Alert! Mar 20, 2019

UUP Chart

  Markets were down earlier today until the FED announced that they would not Raise Rates again this year. Is the Economy really that weak? Bonds and Commodities think so. The US Dollar dropped, and GOLD rose. The S&P 500 Index went … [Read more...]

March 19, 2019

Money Wave Alert Mar 19, 2019

PBR Chart

  Markets "Gapped Up" this morning on panic Buying, but then Selling finally came in later.  The S&P 500 Index has Support at last week's High of 2817. Closing below 2817 would be Bearish.  Many Leaders are back up to their Red Zones, … [Read more...]

March 18, 2019

Money Wave Alert! Mar 18, 2019

XLK Chart

  Markets were slightly higher today on lower Volume.  The S&P 500 Index now has Support at last week's High of 2817. Closing below 2817 would be Bearish.  Many Leaders are back up to their Red Zones, so Short Term Investors should be … [Read more...]

March 17, 2019

Green Line Weekly Mar 17, 2019

SPX Weekly

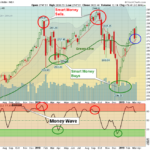
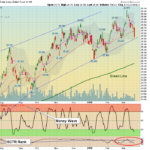
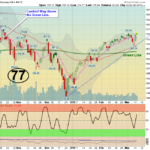
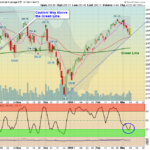
  03/17/2019:  Markets were up for the week, as the major Indices bounced up out of their Green Zones for Money Wave Buys.  Big Tech were leading the way up. Many Investors seem to be betting on a China Trade Deal or more FED help, as few … [Read more...]

March 15, 2019

Money Wave Alert! Mar 15, 2019

SPX Chart

  Markets were up today as the S&P 500 Index was able to pop above last week's High of 2817. Closing above 2817 would be Bullish.  Many Leaders are quickly returning back up to their Red Zones, so Short Term Investors should check … [Read more...]

March 14, 2019

Money Wave Alert! Mar 14, 2019

SPX-60 Chart

  Markets were mixed today as the S&P 500 Index has stalled near last week's High of 2817. Closing above 2817 would be Bullish.  Many Leaders are quickly returning back up to their Red Zones, but many Investments are not moving up … [Read more...]

March 13, 2019

Money Wave Alert! Mar 13, 2019

GDX Chart

  Markets were up again today as the S&P 500 Index went slightly higher than last week's High of 2817. Closing above 2817 would be Bullish. The Tech Funds are stronger on this rally.  Many Leaders have popped up out of the Green Zones … [Read more...]

March 12, 2019

Money Wave Alert! Mar 12, 2019

QQQ Chart

  Markets were up slightly again today as the S&P 500 Index was able to Close above Resistance of the Pink Line (10-day avg.) of  2780.  The high yielding, big Dividend Investments are slow, but are chugging up to new Highs. The … [Read more...]

March 11, 2019

Money Wave Alert! Mar 11, 2019

DIA Chart

  Markets "Gapped Up" today on optimistic Buying as the S&P 500 bounced up out of the Green Zone.  Next Resistance is the Pink Line (10-day avg.) of  2780.  The Leaders are popping up out of the Green Zones for Money Wave Buy Signals. … [Read more...]

  • « Previous Page
  • 1
  • …
  • 352
  • 353
  • 354
  • 355
  • 356
  • …
  • 363
  • Next Page »

Subscribe to Our Newsletter

AGL Logo

Get our eBook Now!

Candlestick - A Swing Traders Friend

We don’t spam! Read our privacy policy for more info.

You’ve been successfully subscribed to our newsletter!

Voted #1 at Stock Charts

SH Chart
Inverse S&P 500 Fund (SH) will have a Money Wave Buy today.

Help Us Help Animals

Help Us Help Animals

Recent Comments

  • Want to Protect Your Capital? Start With Better Position Sizing on Risk Management in Trading: Tools and Techniques
  • Want to Protect Your Capital? Start With Better Position Sizing on Swing Trading Risk Management: Tips To Safeguard Your Profits
  • Price Action Trading Strategies That Work in Any Market on What Is a Death Cross in Stocks? A Bearish Market Signal
  • ATGL Weekly Money Flow - 2025-07-13 on AGTL Top Pick of the Week! May 11, 2025
  • Market Breadth Indicators: A Trader’s Guide to Early Trend Detection on Backtesting: Definition and How a Trading Strategy Backtest Works

Become a Green Liner!

Help me make more Money in the Stock Market.

ON ATGL

  • DashBoard
  • Weekly Commentary
  • Daily Buy / Sell Signals
  • Day Trade Setup
  • Trading Rooms

Design & Develop By Pixelvect

STRATEGIES

  • Swing Trading
  • ATGL Pick of the Week
  • Dividend Growth
  • ETF Sector Rotation
  • Dogs of the Dow

HELP

  • ATGL Trading Rules
  • FAQ
  • Account Maintenance
  • Contact US
  • Join

FOLLOW US

Instagram Linkedin Twitter Facebook

© COPYRIGHT 2024 · ABOVETHEGREENLINE.COM · ALL RIGHTS RESERVED · PRIVACY · TERMS · CONTACT · WATCHLIST · CURRENT