
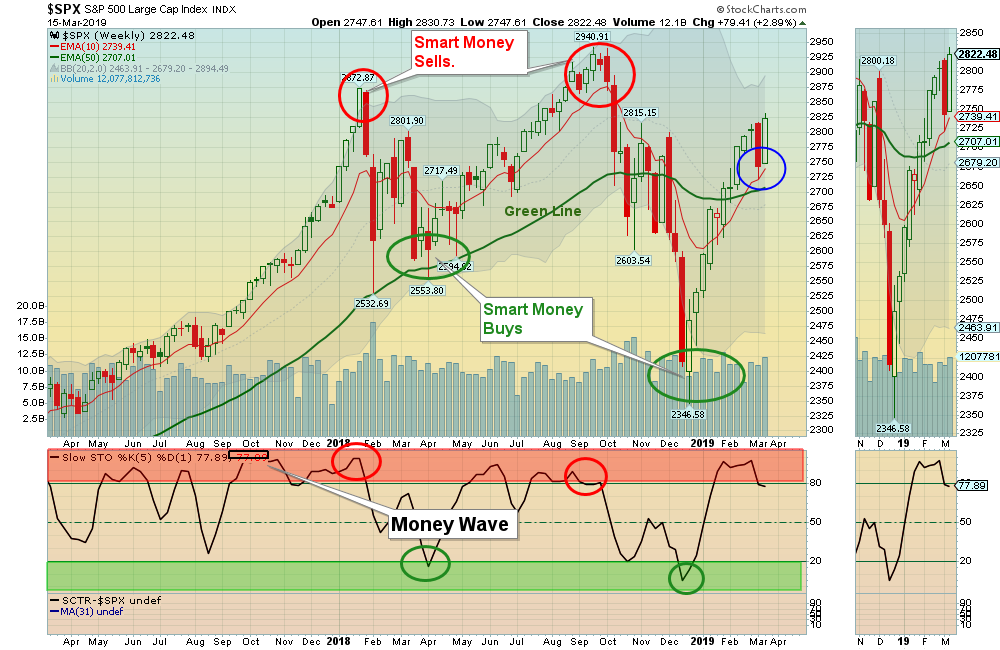
03/17/2019: Markets were up for the week, as the major Indices bounced up out of their Green Zones for Money Wave Buys. Big Tech were leading the way up.
Many Investors seem to be betting on a China Trade Deal or more FED help, as few are currently worrying about Selling. The FEAR INDEX is very low, indicating an Over-bought Market.
For the week the Dow was up 1.57%, the S&P 500 was up 2.95%, and the Nasdaq 100 was up 4.15%. Currently 39% of the S&P 500 Stocks are still below the 200-day avg. (Bearish) even with this 12 week rally up from the Dec Lows. The very Long Term Trend on the Stock Markets is UP.
The Inflation Index (CRB) was up 1.77% but is Below the Green Line, indicating Economic Weakness.
Bonds were up 0.15% for the week and are Above the Green Line, indicating Economic Weakness.
The US DOLLAR was down 0.73% after being up in the Red Zone.
Crude Oil was up 4.37% for the week at $58.52, and GOLD was up 0.28% at $1303.
___________________________________________________________________________________________
MONEY WAVE BUYS SOON:
We are currently in 11 logged Open Positions, for the Short & Medium Term. There are 4 Investments on the Short Term Watch List.
Be patient and WAIT for Green Zone Buy Signals!
______________________________________________________________________________________________
LONG TERM TRADES
Buy the Leading Investments that are down near the weekly Green Zones.
ACAD ARCADIA PHARMA Bought last week at $26.07.
AVP AVON PRODUCTS Bought last week at $2.75.
CROX CROCS INC. Wait for Weekly Money Wave Close > 20.
CYH COMMUNITY HEALTH Bought last week at $4.77.
LW LAMB WESTON HOLDINGS Buy if it Closes above $70.89.
ODP OFFICE DEPOT Bought last week at $3.35.
SBGL SIBANYE GOLD Wait to Buy near the Red Line around $3.75.
VER VEREIT, INC. Relative Strength is Below 80. (7% Dividend)
___________________________________________________________________________________________
Click for Portfolio (Open Positions)
Click for Watch List
Click for Closed Positions
Alert! Market Risk is HIGH (Red Zone). The probability of successful Short Term Trades is better, when the % of stocks above the 50-day avg. is below 20.
Tell your Friends about the Green Line, and Help Animals.
QUESTION: Nancy writes “I would like to know where the Relative Strength factor is located on the charts.”
ANSWER: Hi Nancy, the Relative Strength is usually on the bottom left of each Chart with a Red Box around it (SCTR is StockCharts Technical Rank). Sometimes we use data from:
Relative Strength Values comes from the SCTR Rank (StockCharts Technical Rank), www.etfscreen.com for ETFs , and Investor’s Business Daily (IBD) for stocks. We prefer the longer term weighting used by www.etfscreen.com and IBD.
Sometimes look for Big Numbers with circle around them…
Good trading, and tell your friends!


