Above the Green Line -01
  • Market Insights
        • Commentary
          • Daily
          • Weekly
        • BUY / SELL SIGNALS
          • Trade Posts
          • Recent Trade Alerts
          • Recent Day Trades
        • BLOGROLL
          • Dividend Growth Blog
          • ETF Sector Blog
          • Dow Dogs
          • TPOW Blog
  • Strategies
        • SWING TRADING
          • Current Positions
          • Watchlists
          • Closed Positions
          • Candidates - TOP 100
          • Specialty Stocks
        • WEEKLY STOCK PICK
          • TPOW Charts
          • TPOW Performance
          • TPOW Strategy Guide
          • TPOW Performance Dashboard
        • DAY TRADING
          • Watch List
        • ATGL DASHBOARD
        • ETF STRATEGIES
          • ETF Sector Rotation
          • ETF Sector Portfolio
        • DIVIDEND GROWTH
          • Dividend Growth Portfolio
          • Dividend Calendar
        • DOGS OF THE DOW
          • Dogs of the Dow Portfolio
          • DOW 5 Portfolio
  • Markets
        • US MARKET
          • Commodities
          • Energy
          • Precious Metals
          • Volatility
        • GLOBAL MARKETS
          • Market Indices
          • Economic Calendar
          • FOREX Heat Map
          • FOREX Cross Rates
          • Crypto Currency Market
  • Investing
    • Discord Community
    • Dashboard
  • Resources
        • ARTICLES
          • Dividend Growth Model Articles
          • ETF Articles
          • Investment Strategies Articles
          • Market and Economic Insights
          • Stock Trade Articles
          • Stock Reviews
        • TOOLS
          • Stock Scanners
          • Charting Software
          • Brokerage Firms
        • STOCK CHARTS
          • Key Components
          • Reading Charts
          • Drawing Stock Charts
          • Identifying Trends
        • RETIREMENT PLANNING
  • About
    • Contact Us
    • How to Win
    • #1 At Stockcharts
    • Disclaimer
    • FAQ
  • Log In
  • Subscribe

July 30, 2019

Money Wave Alert! Jul 30, 2019

SID Chart

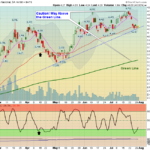
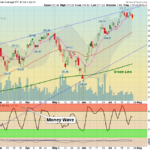
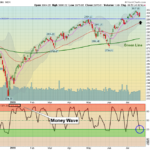
  Markets  were down slightly today as the Markets were over-bought and needed to rest. Many Investors are wanting for the probable FED Rate Cut on Wednesday. The Tech Stocks are extremely over-bought, and most of the Leaders are Way Above … [Read more...]

July 29, 2019

Money Wave Alert! Jul 29, 2019

SPWR Chart

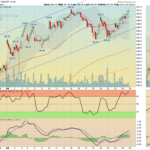
  Markets  were mixed today as the Markets were over-bought and needed to rest. Some of the stronger Tech Software stocks were dow 4-6% on profit taking. Buyers are wanting to get in before the probable FED Rate Cut on Wednesday. The Tech … [Read more...]

July 28, 2019

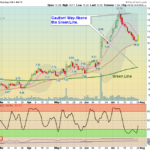
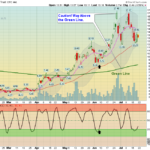
Green Line Weekly Jul 28, 2019

QQQ Chart

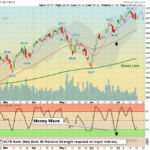
  07/28/2019:  Markets were up for the week, as many Earnings came in better that expected. Also, Investors are expecting the FED to cut Interest Rates at least 1/4 point on July 31. Maybe some profit taking later this week on the "Good News" … [Read more...]

July 26, 2019

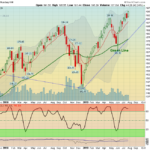
Money Wave Alert! Jul 26, 2019

XLK Chart

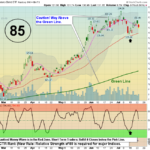
  Markets  were up today as Buyers wanted in before the probable FED Rate Cut next week. The S&P 500 Index was able to bounce up off the Pink Line (10-day avg.) and push up to New Highs on low Volume.  Tech Stocks are extremely … [Read more...]

July 25, 2019

Money Wave Alert! Jul 25, 2019

DIA Chart

  Markets  were down today as Earnings from some larger Companies were disappointing. The S&P 500 Index is struggling again to stay above the Pink Line (10-day avg.) at 3000. There was no good follow thru Buying from yesterday's … [Read more...]

July 24, 2019

Money Wave Alert! Jul 24, 2019

SPY Chart

  Markets  were up today on low summer Volume.  The S&P 500 Index is back up re-testing last week's High after closing back above the Pink Line (10-day avg.).  We will have to see if more Buyers come in from here. Some Leaders are … [Read more...]

July 23, 2019

Money Wave Alert! Jul 23, 2019

TLT Chart

  Markets were up today as Earnings were better than expected on some Companies.  The S&P 500 Index is back above the Pink Line (10-day avg.) so more Buyers are coming in. Maybe a re-test of the Highs this week. The S&P 500 Fund … [Read more...]

July 22, 2019

Money Wave Alert! Jul 22, 2019

SPY Chart

  Markets were up slightly today as the Tech Stocks rallied on low Volume.  The S&P 500 Index is back below the Pink Line (10-day avg.) so there are few Buyers coming in without any Good News. Maybe a re-test of the Highs this … [Read more...]

July 21, 2019

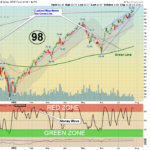
Green Line Weekly Jul 21, 2019

SPX Chart

  07/21/2019:  Markets were down for the week, as most of the major Indices and Leaders were up in their Red Zones (probably too late to Buy for the Short Term). So far the Selling has been minimal as many Investors are expecting the FED to … [Read more...]

July 19, 2019

Money Wave Alert! Jul 19, 2019

GBTC Chart

  Markets were mixed again today after gapping up this morning and then some Sellers came in.  The S&P 500 Index is back below the Pink Line (10-day avg.) as there are few Buyers up here without any Good News News. Maybe a re-test of the … [Read more...]

  • « Previous Page
  • 1
  • …
  • 341
  • 342
  • 343
  • 344
  • 345
  • …
  • 363
  • Next Page »

Subscribe to Our Newsletter

AGL Logo

Get our eBook Now!

Candlestick - A Swing Traders Friend

We don’t spam! Read our privacy policy for more info.

You’ve been successfully subscribed to our newsletter!

Voted #1 at Stock Charts

SH Chart
Inverse S&P 500 Fund (SH) will have a Money Wave Buy today.

Help Us Help Animals

Help Us Help Animals

Recent Comments

  • Breakout Trading Strategies That Can Boost Your Gains on 7 Day Trading Strategies for New Investors
  • What the Descending Staircase Pattern Tells You About the Market on Bull vs. Bear Market: An Investor’s Guide to Market Phases
  • Want to Protect Your Capital? Start With Better Position Sizing on Risk Management in Trading: Tools and Techniques
  • Want to Protect Your Capital? Start With Better Position Sizing on Swing Trading Risk Management: Tips To Safeguard Your Profits
  • Price Action Trading Strategies That Work in Any Market on What Is a Death Cross in Stocks? A Bearish Market Signal

Become a Green Liner!

Help me make more Money in the Stock Market.

ON ATGL

  • DashBoard
  • Weekly Commentary
  • Daily Buy / Sell Signals
  • Day Trade Setup
  • Trading Rooms

Design & Develop By Pixelvect

STRATEGIES

  • Swing Trading
  • ATGL Pick of the Week
  • Dividend Growth
  • ETF Sector Rotation
  • Dogs of the Dow

HELP

  • ATGL Trading Rules
  • FAQ
  • Account Maintenance
  • Contact US
  • Join

FOLLOW US

Instagram Linkedin Twitter Facebook

© COPYRIGHT 2024 · ABOVETHEGREENLINE.COM · ALL RIGHTS RESERVED · PRIVACY · TERMS · CONTACT · WATCHLIST · CURRENT