Above the Green Line -01
  • Market Insights
        • Commentary
          • Daily
          • Weekly
        • BUY / SELL SIGNALS
          • Trade Posts
          • Recent Trade Alerts
          • Recent Day Trades
        • BLOGROLL
          • Dividend Growth Blog
          • ETF Sector Blog
          • Dow Dogs
          • TPOW Blog
  • Strategies
        • SWING TRADING
          • Current Positions
          • Watchlists
          • Closed Positions
          • Candidates - TOP 100
          • Specialty Stocks
        • WEEKLY STOCK PICK
          • TPOW Charts
          • TPOW Performance
          • TPOW Strategy Guide
          • TPOW Performance Dashboard
        • DAY TRADING
          • Watch List
        • ATGL DASHBOARD
        • ETF STRATEGIES
          • ETF Sector Rotation
          • ETF Sector Portfolio
        • DIVIDEND GROWTH
          • Dividend Growth Portfolio
          • Dividend Calendar
        • DOGS OF THE DOW
          • Dogs of the Dow Portfolio
          • DOW 5 Portfolio
  • Markets
        • US MARKET
          • Commodities
          • Energy
          • Precious Metals
          • Volatility
        • GLOBAL MARKETS
          • Market Indices
          • Economic Calendar
          • FOREX Heat Map
          • FOREX Cross Rates
          • Crypto Currency Market
  • Investing
    • Discord Community
    • Dashboard
  • Resources
        • ARTICLES
          • Dividend Growth Model Articles
          • ETF Articles
          • Investment Strategies Articles
          • Market and Economic Insights
          • Stock Trade Articles
          • Stock Reviews
        • TOOLS
          • Stock Scanners
          • Charting Software
          • Brokerage Firms
        • STOCK CHARTS
          • Key Components
          • Reading Charts
          • Drawing Stock Charts
          • Identifying Trends
        • RETIREMENT PLANNING
  • About
    • Contact Us
    • How to Win
    • #1 At Stockcharts
    • Disclaimer
    • FAQ
  • Log In
  • Subscribe

July 21, 2019

Green Line Weekly Jul 21, 2019

SPX Chart
The S&P 500 Index should have Support at 2954.


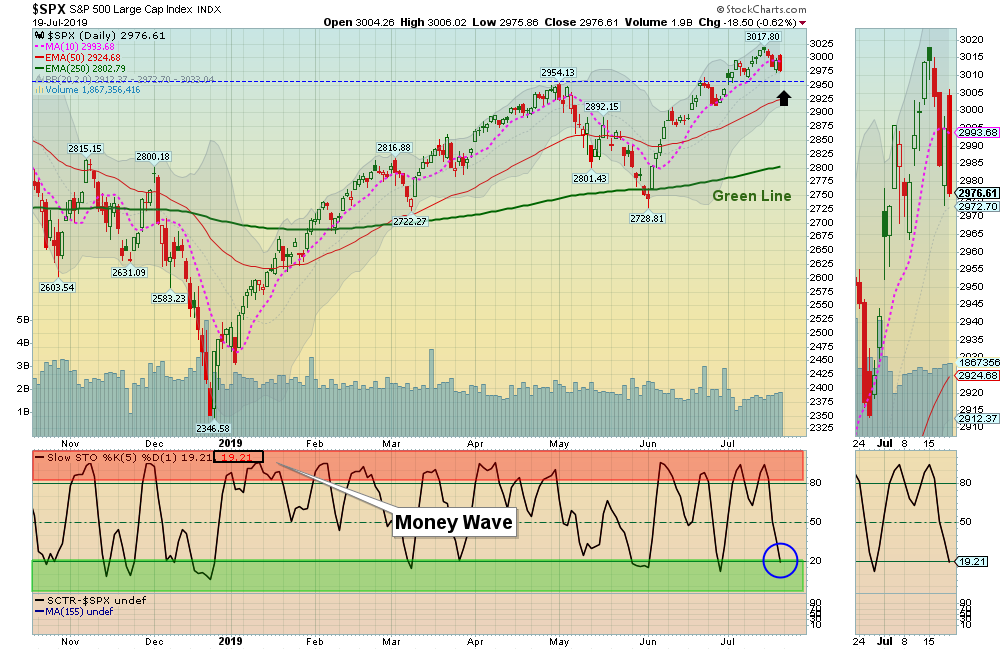
07/21/2019:  Markets were down for the week, as most of the major Indices and Leaders were up in their Red Zones (probably too late to Buy for the Short Term). So far the Selling has been minimal as many Investors are expecting the FED to cut Interest Rates 1/4 point on July 31. The S&P 500 Index should have good Support at the May Highs of 2954.

Most of the Leaders are not pulling back much when they return to their Green Zones, which indicates that the Buyers still have money and they currently have no FEAR.

For the week the Dow was down 0.65%, the S&P 500 was down 1.23%, and the Nasdaq 100 was down 1.30%.  The Long Term Trend on the Stock Markets is UP. 


The Inflation Index (CRB) was down 3.13% and is Below the Green Line, indicating Economic Weakness.

Bonds were up 1.13% for the week and are Way Above the Green Line, indicating Economic Weakness.

The US DOLLAR was up 0.38% and it could be having a huge Double Top from 3 years ago. 

Crude Oil was down 7.39% for the week at $55.76, and GOLD was up 1.03%  at $1426.70.

___________________________________________________________________________________________

COMPLETED TRADES THIS WEEK:    NONE


MONEY WAVE BUYS SOON:   

We are currently in 5 logged Open Positions, for the Short & Medium Term.  There are 5 Investments on the Short Term Watch List. 

Be patient and WAIT for Green Zone Buy Signals!

______________________________________________________________________________________________

LONG TERM INVESTMENTS 

Buy the Leading Investments that are down near the weekly Green Zones.   

HZNP     HORIZON PHARM.      Wait for Weekly Close Above the Red Line of $24.37.     

IONS     IONIS PHARM.      Try to Buy near the Red Line around 66.83.

RAMP     LIVE RAMP HOLDINGS      Wait for Weekly Close Above the Red Line of $50.83.

VMW    VMWARE INC.    Wait for next Daily Green Zone Buy.

___________________________________________________________________________________________

Click for  Portfolio (Open Positions)  
Click for  Watch List
Click for  Closed Positions


Alert! Market Risk is HIGH (Red Zone). The probability of successful Short Term Trades is better, when the % of stocks above the 50-day avg. is below 20. 

Tell your Friends about the Green Line, and Help Animals

___________________________________________________________________________________________

QUESTION: Peter W. writes “When you say the RSI should be “ABOVE 90 RSI “.  I look at your chart and it shows  SCTR 90,  not RSI.  Please clarify.

ANSWER:   Hi Peter. We don’t use RSI, which is a technical oscillator.  We use Relative Strength compared to the Market:

Q: Where do I find the Relative Strength Factor in StockCharts.com so I can add it to my charts?

A: Relative Strength Values comes from the SCTR Rank (StockCharts Technical Rank), www.etfscreen.com for ETFs , and Investor’s Business Daily (IBD) for stocks. We prefer the longer term weighting used by www.etfscreen.com and IBD.  We sometimes use a 155-day avg. of StockCharts SCTR, which is at the bottom left of many charts (just below the SCTR Rank) to simulate R S closer to the longer term ranking of IBD ranking.

Good trading, and tell your friends!

AGL

Related Post

– Green Line Weekly Jul 14, 2019

Subscribe to Our Newsletter

AGL Logo

Get our eBook Now!

Candlestick - A Swing Traders Friend

We don’t spam! Read our privacy policy for more info.

You’ve been successfully subscribed to our newsletter!

Voted #1 at Stock Charts

SH Chart
Inverse S&P 500 Fund (SH) will have a Money Wave Buy today.

Help Us Help Animals

Help Us Help Animals

Recent Comments

  • Market Breadth Indicators: A Trader’s Guide to Early Trend Detection on Backtesting: Definition and How a Trading Strategy Backtest Works
  • Island Reversal Pattern: Definition and Formation Explained on Double Top Pattern: How to Identify and Trade This Reversal Signal
  • Channel Pattern Guide: What It Is and Why It Matters on A Guide to Forecasting Using Moving Averages
  • What Is a Broadening Bottom Chart Pattern? Full Guide on Bull vs. Bear Market: An Investor’s Guide to Market Phases
  • ATGL Weekly Money Flow - 2025-05-11 on ATGL Top Pick of the Week! Apr 6, 2025

Become a Green Liner!

Help me make more Money in the Stock Market.

ON ATGL

  • DashBoard
  • Weekly Commentary
  • Daily Buy / Sell Signals
  • Day Trade Setup
  • Trading Rooms

Design & Develop By Pixelvect

STRATEGIES

  • Swing Trading
  • ATGL Pick of the Week
  • Dividend Growth
  • ETF Sector Rotation
  • Dogs of the Dow

HELP

  • ATGL Trading Rules
  • FAQ
  • Account Maintenance
  • Contact US
  • Join

FOLLOW US

Instagram Linkedin Twitter Facebook

© COPYRIGHT 2024 · ABOVETHEGREENLINE.COM · ALL RIGHTS RESERVED · PRIVACY · TERMS · CONTACT · WATCHLIST · CURRENT