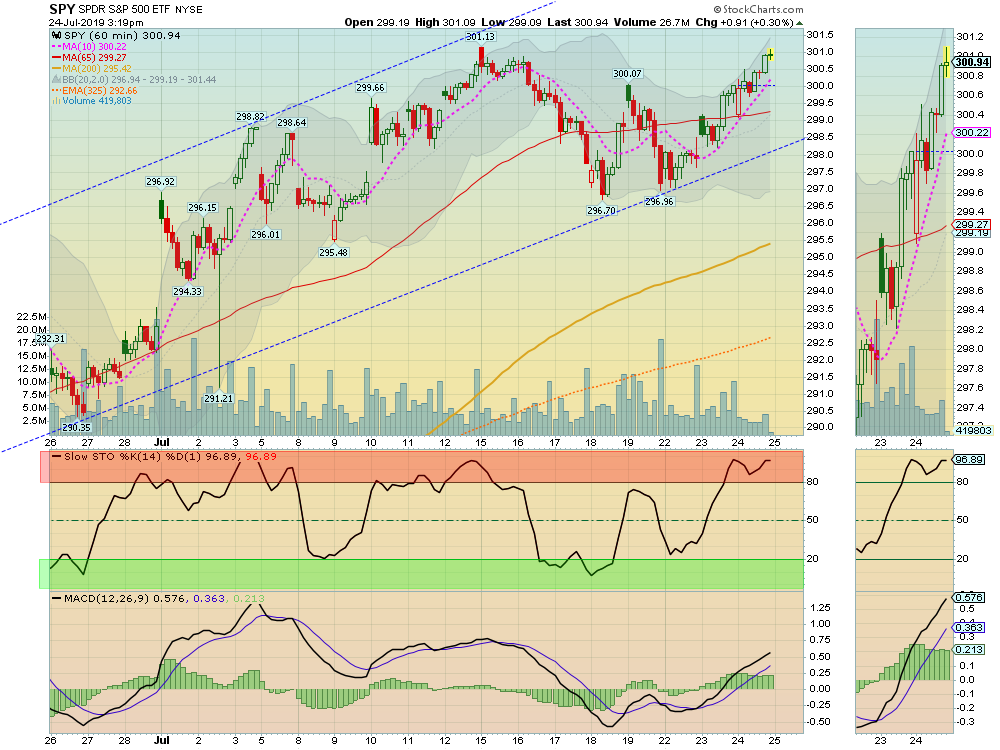
Markets were up today on low summer Volume. The S&P 500 Index is back up re-testing last week’s High after closing back above the Pink Line (10-day avg.). We will have to see if more Buyers come in from here.
Some Leaders are back up in the Red Zones (probably too late to Buy for the Short Term).
Crude Oil was down $0.80 today at $55.80.
_____________________________________________________________________________________________________________________________
The Following Investments will probably have a Money Wave Buy Signal soon.
(Slow Stochastic Closing > 20) on today’s Close.
BUYS TODAY 7/24/2019
XRX XEROX CORP. Money Wave Buy today. Target is $37.00. EXIT if it is going to Close below Support of $33.94.
RCII RENT-A-CENTER Money Wave Buy today. RCII will not be logged, as the Volume is below average.
TEAM ATLASSIAN CORP. Money Wave Buy today. TEAM will not be logged, as the Volume is below average.
We will “Not Log” trades if the Reward/Risk is not at least 2:1.
Money Wave Buys Signals Soon: (Best to Buy these when the S&P 500 is also in the Green Zone.)
SPWR SUNPOWER CORP.
VEEV VEEVA SYSTEMS
WMT WALMART INC.
Please be patient and wait for Money Wave Buy Signals. We will email you when they are ready. Click on Watch List.
Emotions are very high now, so please do not Buy unless you are VERY NIMBLE.
The Leaders are Way Above the Green Lines (all Investments eventually return to their Green Lines).
______________________________________________________________________________________
SELLS TODAY
LOWER the Sell Stop Loss on HEXO HEXO CORP. to $4.00 until it bottoms.
Check PORTFOLIO (Open Positions) and adjust your Sell Stops.
Click for CLOSED POSITIONS.
Many like to Buy the day before, near the Close, if the Money Wave is going to create a Buy Signal (Closing > 20).
Don’t Buy if the Investment has already popped up too much. Money Wave Buys are usually good for a 3-6 % move in a few days.
We will “Not Log” trades if the Reward/Risk is not at least 2:1.