
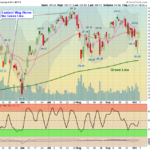
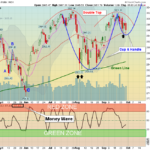
10/06/2019: Markets did not bounce up at the Red Lines (50-day avgs.) last week, and dropped down near the Green Lines before bouncing back up. So far the Bears got a Double Top pattern on the S&P 500 Index. But the Bulls are … [Read more...]
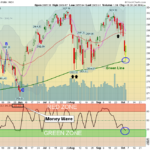
Money Wave Alert! Oct 4, 2019
Markets were up again today as the S&P 500 Index is almost back up to the Red Line of 2949 and Resistance. Volume is Low. Emotions are High as Investors react from Good News and Bad News each day. This indicates equilibrium: same … [Read more...]
Money Wave Alert! Oct 3, 2019
Markets were up slightly today after the S&P 500 Index dipped down almost to the Green Line this morning, and bounced. The S&P 500 Index is back down in the Green Zone, but the Relative Strength has dropped below 80 required for … [Read more...]
Money Wave Alert! Oct 2, 2019
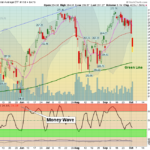
Markets were down again today after the S&P 500 Index closed below the Red Line (50-day avg.) yesterday and then sold off more today. Now Support is the Green Line at 2852. The Tech stocks have been under a lot of pressure, and are … [Read more...]
Money Wave Alert! Oct 1, 2019
Markets were down today after the S&P 500 Index went slightly above the Pink Line (10-day avg.) and then sold off. Closing above 2981 on the S&P 500 should bring in more Buying. The Tech stocks have been under a lot of pressure, … [Read more...]
Money Wave Alert! Sep 30, 2019
Markets were up today as the S&P 500 Index is trying again to get up above the Pink Line (10-day avg.) Closing above 2987 on the S&P 500 should bring in more Buying. The Tech stocks have been under a lot of pressure, and some are … [Read more...]
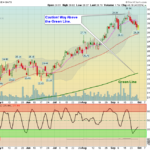
Green Line Weekly Sept 29, 2019
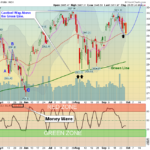
09/29/2019: Markets were down again for the week, as the Bears are betting on a Double Top on the S&P 500 Index. The Bulls are betting on a "Cup & Handle" pattern. A Cup & Handle pattern would normally stall at Resistance, fade … [Read more...]
Green Line Weekly Sep 29, 2019
09/29/2019: Markets were down again for the week, as the Bears are betting on a Double Top on the S&P 500 Index. The Bulls are betting on a "Cup & Handle" pattern. A Cup & Handle pattern would normally stall at Resistance, fade … [Read more...]
Money Wave Alert! Sep 27, 2019
Markets were down today on lower Volume as the S&P 500 Index failed again to get up above the Pink Line (10-day avg.) this morning and bring in more Buying. Now the S&P 500 needs to hold at the Red Line (50-day avg.) around 2952. … [Read more...]
Money Wave Alert! Sep 26, 2019
Markets were down slightly today after rallying back up from a low this morning. The S&P 500 Index went almost down to the Red Line (50-day avg.) and bounced. The S&P 500 Index could be going up on Wave 5 of the move back up to the … [Read more...]
- « Previous Page
- 1
- …
- 335
- 336
- 337
- 338
- 339
- …
- 363
- Next Page »