
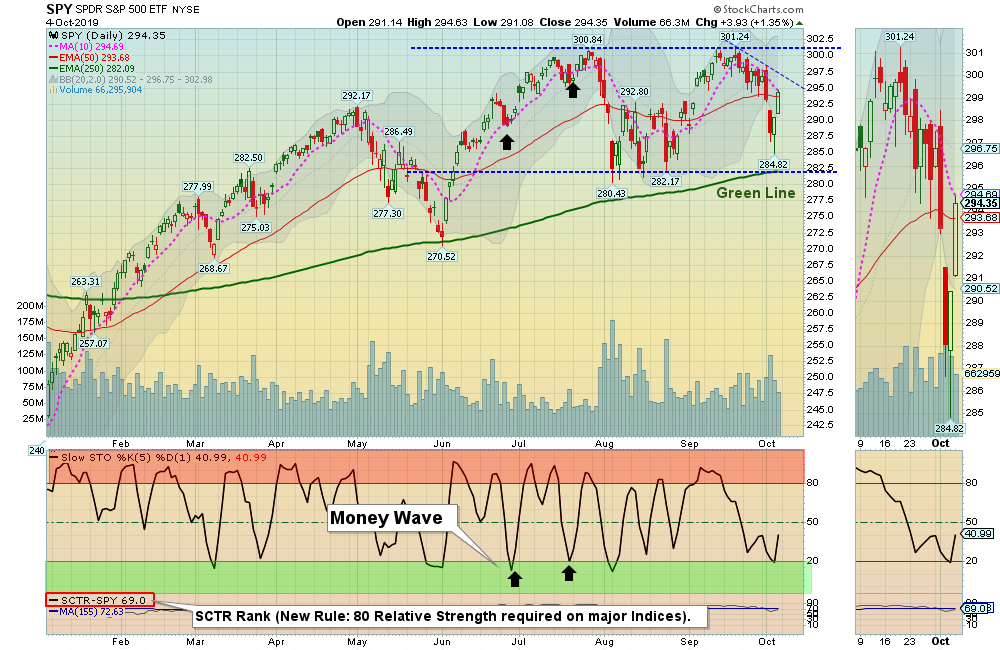
10/06/2019: Markets did not bounce up at the Red Lines (50-day avgs.) last week, and dropped down near the Green Lines before bouncing back up. So far the Bears got a Double Top pattern on the S&P 500 Index. But the Bulls are encouraged by the big bounce on Thursday and Friday.
So the Markets are in a sideways move between the Highs and the Support of the Green Line. Sideways means “Indecision” and then normally a Big Move is coming (Up or Down). We must Wait for the Markets to “tell us”.
For the week the Dow was down 0.87%, the S&P 500 was down 0.36%, and the Nasdaq 100 was up 0.95%. The Long Term Trend on the Stock Markets is UP.
The Inflation Index (CRB) was down 1.26% and is Below the Green Line, indicating Economic Weakness.
Bonds were up 2.46% for the week and are Above the Green Line, indicating Economic Weakness.
The US DOLLAR was down 0.19%, after making a 3 year High.
Crude Oil was down 5.54% for the week at $52.81, and GOLD was up 0.43% at $1512.90.
___________________________________________________________________________________________
MONEY WAVE BUYS SOON:
We are currently in 9 logged Open Positions, for the Short & Medium Term. There are 3 Investments on the Short Term Watch List.
Be patient and WAIT for Green Zone Buy Signals!
______________________________________________________________________________________________
LONG TERM INVESTMENTS
Buy the Leading Investments that are down near the weekly Green Zones.
AYX ALTERYX INC. Buy if it is going to Close above $113.15.
CDNS CADENCE DESIGN Buy if it is going to Close above $67.69.
CVNA CARVANA CO. Buy if it is going to Close above the Red Line of $72.55.
SBGI SINCLAIR BROADCAST GROUP Buy if it is going to Close above $45.73.
SBUX STARBUCKS CORP. Buy if it is going to Close above the Red Line of $90.58.
TLRA TELARIA INC. Buy if it is going to Close above the Red Line of $8.12.
TTD TRADE DESK INC. Buy if it is going to Close above $199.36.
___________________________________________________________________________________________
Click for Portfolio (Open Positions)
Click for Watch List
Click for Closed Positions
Alert! Market Risk is MEDIUM (Yell0w Zone). The probability of successful Short Term Trades is better, when the % of stocks above the 50-day avg. is below 20.
Tell your Friends about the Green Line, and Help Animals
___________________________________________________________________________________________
4 Ways to Get your Daily Money Wave Alert: You might want a backup plan… Twitter notifications are the and fastest and most reliable.
- Emailed to your box between 3:30 3:50pm EDT.
- Website menu Commentary/Buy/Sell Signals
- Twitter notifications @AboveGreenLine
- Text messages: Email us your Cell number & phone carrier.


