Above the Green Line -01
  • Market Insights
        • Commentary
          • Daily
          • Weekly
        • BUY / SELL SIGNALS
          • Trade Posts
          • Recent Trade Alerts
          • Recent Day Trades
        • BLOGROLL
          • Dividend Growth Blog
          • ETF Sector Blog
          • Dow Dogs
          • TPOW Blog
  • Strategies
        • SWING TRADING
          • Current Positions
          • Watchlists
          • Closed Positions
          • Candidates - TOP 100
          • Specialty Stocks
        • WEEKLY STOCK PICK
          • TPOW Charts
          • TPOW Performance
          • TPOW Strategy Guide
          • TPOW Performance Dashboard
        • DAY TRADING
          • Watch List
        • ATGL DASHBOARD
        • ETF STRATEGIES
          • ETF Sector Rotation
          • ETF Sector Portfolio
        • DIVIDEND GROWTH
          • Dividend Growth Portfolio
          • Dividend Calendar
        • DOGS OF THE DOW
          • Dogs of the Dow Portfolio
          • DOW 5 Portfolio
  • Markets
        • US MARKET
          • Commodities
          • Energy
          • Precious Metals
          • Volatility
        • GLOBAL MARKETS
          • Market Indices
          • Economic Calendar
          • FOREX Heat Map
          • FOREX Cross Rates
          • Crypto Currency Market
  • Investing
    • Discord Community
    • Dashboard
  • Resources
        • ARTICLES
          • Dividend Growth Model Articles
          • ETF Articles
          • Investment Strategies Articles
          • Market and Economic Insights
          • Stock Trade Articles
          • Stock Reviews
        • TOOLS
          • Stock Scanners
          • Charting Software
          • Brokerage Firms
        • STOCK CHARTS
          • Key Components
          • Reading Charts
          • Drawing Stock Charts
          • Identifying Trends
        • RETIREMENT PLANNING
  • About
    • Contact Us
    • How to Win
    • #1 At Stockcharts
    • Disclaimer
    • FAQ
  • Log In
  • Subscribe

December 9, 2021

Money Wave Alert! Dec 9, 2021

ITB Chart

Markets were slightly weaker today after a sharp rally earlier this week. Soon the stronger S&P 500 and NASDAQ 100 Indices need to exceed the November Highs to remain Bullish. The weaker DOW 30, NYSE, and Small Cap Indices are not very far above … [Read more...]

December 8, 2021

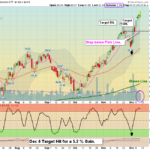
Money Wave Alert! Dec 8, 2021

BKKT Chart

Markets were mixed again today after two strong rally days this week. Now the stronger S&P 500 and NASDAQ 100 Indices need to exceed the November Highs to remain Bullish. Last week there was plenty of Investor FEAR from a Virus, and now it is … [Read more...]

December 7, 2021

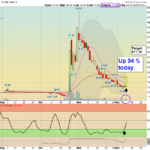
Money Wave Alert! Dec 7, 2021

DIA Chart

Markets were higher again today as the Indices rallied on mild Buying. The stronger S&P 500 and NASDAQ 100 Indices should re-test the November Highs soon. The weaker Small Cap Index is still below the Red Line (50-day avg.) as the rally is not … [Read more...]

December 6, 2021

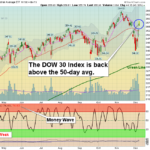
Money Wave Alert! Dec 6, 2021

QQQ Chart

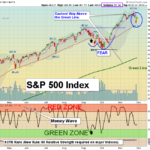
Markets were higher today as the Indices were very over-sold and we got several Money Wave Buy Signals (please see below). The stronger S&P 500 and NASDAQ 100 Indices were in the Green Zones on Friday, and both were bought today on Money Wave Buy … [Read more...]

December 5, 2021

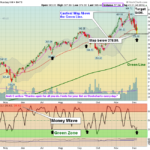
Green Line Weekly Dec 5, 2021

Green Line Weekly

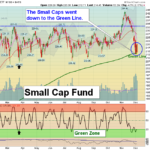
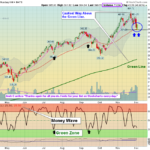
12/05/2021 Markets were down again for the week, as the major Indices are relieving the over-bought condition (Way Above the Green Lines). The weaker DOW 30, NYSE, and Small Cap Indices are almost down to their Green Lines, as Investor's FEAR shot … [Read more...]

December 3, 2021

Money Wave Alert! Dec 3, 2021

IWM Chart

Markets were lower today as the Indices went back down to re-test Wednesday's Low. The S&P 500 and NASDAQ 100 Indices went slightly lower than  Wednesday, but look like they will hold by the end of today. They are slightly below the Red Lines … [Read more...]

December 2, 2021

Money Wave Alert! Dec 2, 2021

QQQ Chart

Markets were higher today as the Selling was over done for the Short Term. The S&P 500 and NASDAQ 100 Indices are holding above the Red Lines (50-day avgs.) for the Markets to maintain upward momentum and re-test the Highs. The S&P 500 Index … [Read more...]

December 1, 2021

Money Wave Alert! Dec 1, 2021

ITB Chart

Markets were higher this morning, and then sold off. The S&P 500 and NASDAQ 100 Indices are trying to hold here near the Red Lines (50-day avgs.) for the Markets to maintain upward momentum. The S&P 500 Index is back down in the Green Zone … [Read more...]

November 30, 2021

Money Wave Alert! Nov 30, 2021

SPX Chart

Markets were lower today as the Indices are re-testing Friday's Lows. The S&P 500 and NASDAQ 100 Indices need to hold here at the Red Lines (50-day avgs.) for the Markets to maintain upward momentum. The weaker DOW 30, NYSE & Small Cap … [Read more...]

November 29, 2021

Money Wave Alert! Nov 29, 2021

SPY Chart

Markets were higher today after Friday's drop, but the Buying was weak as investors have not seen a good Short Term bottom for Stock prices yet. The strongest S&P 500 and NASDAQ 100 Indices were able to hold up above the Red Lines (50-day avgs.) … [Read more...]

  • « Previous Page
  • 1
  • …
  • 243
  • 244
  • 245
  • 246
  • 247
  • …
  • 363
  • Next Page »

Subscribe to Our Newsletter

AGL Logo

Get our eBook Now!

Candlestick - A Swing Traders Friend

We don’t spam! Read our privacy policy for more info.

You’ve been successfully subscribed to our newsletter!

Voted #1 at Stock Charts

SH Chart
Inverse S&P 500 Fund (SH) will have a Money Wave Buy today.

Help Us Help Animals

Help Us Help Animals

Recent Comments

  • Want to Protect Your Capital? Start With Better Position Sizing on Risk Management in Trading: Tools and Techniques
  • Want to Protect Your Capital? Start With Better Position Sizing on Swing Trading Risk Management: Tips To Safeguard Your Profits
  • Price Action Trading Strategies That Work in Any Market on What Is a Death Cross in Stocks? A Bearish Market Signal
  • ATGL Weekly Money Flow - 2025-07-13 on AGTL Top Pick of the Week! May 11, 2025
  • Market Breadth Indicators: A Trader’s Guide to Early Trend Detection on Backtesting: Definition and How a Trading Strategy Backtest Works

Become a Green Liner!

Help me make more Money in the Stock Market.

ON ATGL

  • DashBoard
  • Weekly Commentary
  • Daily Buy / Sell Signals
  • Day Trade Setup
  • Trading Rooms

Design & Develop By Pixelvect

STRATEGIES

  • Swing Trading
  • ATGL Pick of the Week
  • Dividend Growth
  • ETF Sector Rotation
  • Dogs of the Dow

HELP

  • ATGL Trading Rules
  • FAQ
  • Account Maintenance
  • Contact US
  • Join

FOLLOW US

Instagram Linkedin Twitter Facebook

© COPYRIGHT 2024 · ABOVETHEGREENLINE.COM · ALL RIGHTS RESERVED · PRIVACY · TERMS · CONTACT · WATCHLIST · CURRENT