Above the Green Line -01
  • Market Insights
        • Commentary
          • Daily
          • Weekly
        • BUY / SELL SIGNALS
          • Trade Posts
          • Recent Trade Alerts
          • Recent Day Trades
        • BLOGROLL
          • Dividend Growth Blog
          • ETF Sector Blog
          • Dow Dogs
          • TPOW Blog
  • Strategies
        • SWING TRADING
          • Current Positions
          • Watchlists
          • Closed Positions
          • Candidates - TOP 100
          • Specialty Stocks
        • WEEKLY STOCK PICK
          • TPOW Charts
          • TPOW Performance
          • TPOW Strategy Guide
          • TPOW Performance Dashboard
        • DAY TRADING
          • Watch List
        • ATGL DASHBOARD
        • ETF STRATEGIES
          • ETF Sector Rotation
          • ETF Sector Portfolio
        • DIVIDEND GROWTH
          • Dividend Growth Portfolio
          • Dividend Calendar
        • DOGS OF THE DOW
          • Dogs of the Dow Portfolio
          • DOW 5 Portfolio
  • Markets
        • US MARKET
          • Commodities
          • Energy
          • Precious Metals
          • Volatility
        • GLOBAL MARKETS
          • Market Indices
          • Economic Calendar
          • FOREX Heat Map
          • FOREX Cross Rates
          • Crypto Currency Market
  • Investing
    • Discord Community
    • Dashboard
  • Resources
        • ARTICLES
          • Dividend Growth Model Articles
          • ETF Articles
          • Investment Strategies Articles
          • Market and Economic Insights
          • Stock Trade Articles
          • Stock Reviews
        • TOOLS
          • Stock Scanners
          • Charting Software
          • Brokerage Firms
        • STOCK CHARTS
          • Key Components
          • Reading Charts
          • Drawing Stock Charts
          • Identifying Trends
        • RETIREMENT PLANNING
  • About
    • Contact Us
    • How to Win
    • #1 At Stockcharts
    • Disclaimer
    • FAQ
  • Log In
  • Subscribe

December 1, 2021

Money Wave Alert! Dec 1, 2021

ITB Chart
Money Wave Buy Signal on the Home Building Fund (ITB).

Markets were higher this morning, and then sold off. The S&P 500 and NASDAQ 100 Indices are trying to hold here near the Red Lines (50-day avgs.) for the Markets to maintain upward momentum. The S&P 500 Index is back down in the Green Zone for a Money Wave Buy Signal soon. The weaker DOW 30, NYSE & Small Cap Indices are over-sold on the Short Term.

New Investors:  Please be patient and WAIT for Money Wave Buy Signals. The better trades happen when the S&P 500 Index is also in the Green Zone (finally back down to Green Zone).  

Several Day Trading Pops this morning: HUT (+7%) LCID (+6%) MARA (+11%) RIOT (+8%) RBLX (+5%). Soon for AMC BGFV HIVE HUT LCID M OCGN RIVN & TSLA in DAY TRADING SETUPS.  Try out the New Side by Side layout.   

NEW! DAY TRADING FOR INDICES & LARGE CAPS.

New TOP 100 LIST Updated Dec 1, 2021

Bonds  were higher today, and are Above the Green Line.

Crude Oil was down $0.95 today at $65.24.

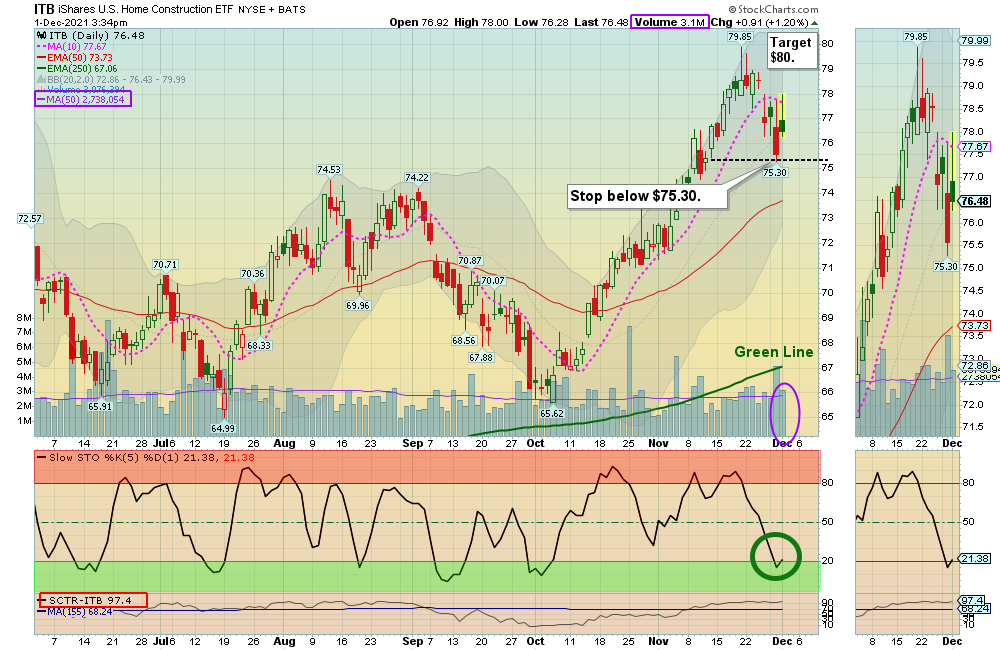
BUYS TODAY    12/01/2021    

ITB      HOME BUILDING FUND      Money Wave today. Target is $80.  EXIT if it is going to Close below $75.30. 

_________________________________________________________________________________________________

JUMP START STOCKS  Shop for a better price earlier in the day. Only use Jump Start on the same day that a Daily Money Wave Buy Signal will occur.

BKKT      BAKKT HOLDINGS INC.      Wait for Money Wave Close > 20 with High Volume.         

_________________________________________________________________________________________________

SWING TRADING WATCH LIST (Click here)       WATCH LIST SCROLLING CHARTS

LC      LENDING CLUB CORP.      Buy above $36.98 with High Volume with a 5% Trailing Sell Stop Loss below it. 

M      MACY’S INC.      Wait for Money Wave Close > 20 with High Volume.   

UPST      UPSTART HOLDINGS    Wait to try to Buy soon on the next bounce. (2nd Buy Signal soon). 

XLY      CONSUMER  DISCRETIONARY FUND      Wait for Money Wave Close > 20 with High Volume.       

Please be patient and wait for Money Wave Buy Signals.  We will email you when they are ready. Follow on the WATCH LIST.      
Emotions are very high now, so please do not Buy unless you are VERY NIMBLE.

The Leaders are Way Above the Green Lines (all Investments eventually return to their Green Lines).      

____________________________________________________________________________________________________________

SELLS TODAY     

EVGO      EVGO INC.      EXIT if it is going to Close below the Green Line of $12.19.  This trade was not logged.

HIVE      HIVE BLOCKCHAIN      EXIT if it is going to Close below Support of $3.56.     

NET      CLOUDFLARE INC.      EXIT if it is going to Close below $175.75.  This trade was not logged.     

TSLA      TESLA INC.      EXIT if it is going to Close below the Pink Line around $1119.10.  The Target was already Hit at $1175 for a 13.7 % Gain.  

UEC      URANIUM ENERGY CORP.      Sliced below Support of $3.88 today. EXIT for a loss, or we will keep UEC and CHANGE to a Long Term Trade (Stop below the Green Line of $2.81). UEC just made a fresh New High and the Relative Strength is 98. The Weekly Chart still looks great. Maybe try to Sell around $4.50.

UPST      UPSTART HOLDINGS      Lower Sell Stop Loss below $160 until it bottoms.

MY TRADING DASHBOARD
DAY TRADING SETUPS
TRADE ALERTS
ARE YOUR INVESTMENTS ABOVE THE GREEN LINE?
ETF SECTOR ROTATION SYSTEM   
New TOP 100 LIST Updated Dec 1, 2021

Many like to Buy the day before, near the Close, if the Money Wave is going to create a Buy Signal (Closing > 20 and out of the Green Zone).

Don’t Buy if the Investment has already popped up too much. Money Wave Buys are usually good for a 3-6 %  move in a few days.

We will “Not Log” trades if the Reward/Risk is not at least 2:1, or Low Volume. These have more risk.   

Related Post

– Money Wave Alert! Nov 30, 2021

Subscribe to Our Newsletter

AGL Logo

Get our eBook Now!

Candlestick - A Swing Traders Friend

We don’t spam! Read our privacy policy for more info.

You’ve been successfully subscribed to our newsletter!

Voted #1 at Stock Charts

SH Chart
Inverse S&P 500 Fund (SH) will have a Money Wave Buy today.

Help Us Help Animals

Help Us Help Animals

Recent Comments

  • Market Breadth Indicators: A Trader’s Guide to Early Trend Detection on Backtesting: Definition and How a Trading Strategy Backtest Works
  • Island Reversal Pattern: Definition and Formation Explained on Double Top Pattern: How to Identify and Trade This Reversal Signal
  • Channel Pattern Guide: What It Is and Why It Matters on A Guide to Forecasting Using Moving Averages
  • What Is a Broadening Bottom Chart Pattern? Full Guide on Bull vs. Bear Market: An Investor’s Guide to Market Phases
  • ATGL Weekly Money Flow - 2025-05-11 on ATGL Top Pick of the Week! Apr 6, 2025

Become a Green Liner!

Help me make more Money in the Stock Market.

ON ATGL

  • DashBoard
  • Weekly Commentary
  • Daily Buy / Sell Signals
  • Day Trade Setup
  • Trading Rooms

Design & Develop By Pixelvect

STRATEGIES

  • Swing Trading
  • ATGL Pick of the Week
  • Dividend Growth
  • ETF Sector Rotation
  • Dogs of the Dow

HELP

  • ATGL Trading Rules
  • FAQ
  • Account Maintenance
  • Contact US
  • Join

FOLLOW US

Instagram Linkedin Twitter Facebook

© COPYRIGHT 2024 · ABOVETHEGREENLINE.COM · ALL RIGHTS RESERVED · PRIVACY · TERMS · CONTACT · WATCHLIST · CURRENT